Who it's for · Managing partners
Know where future work is coming from, and where you are exposed.
You need confidence in the pipeline without running the pipeline. New Dynamics gives you revenue projected in scenarios, risk flagged with reasons, and the firm's relationship exposure drawn where you can see it.
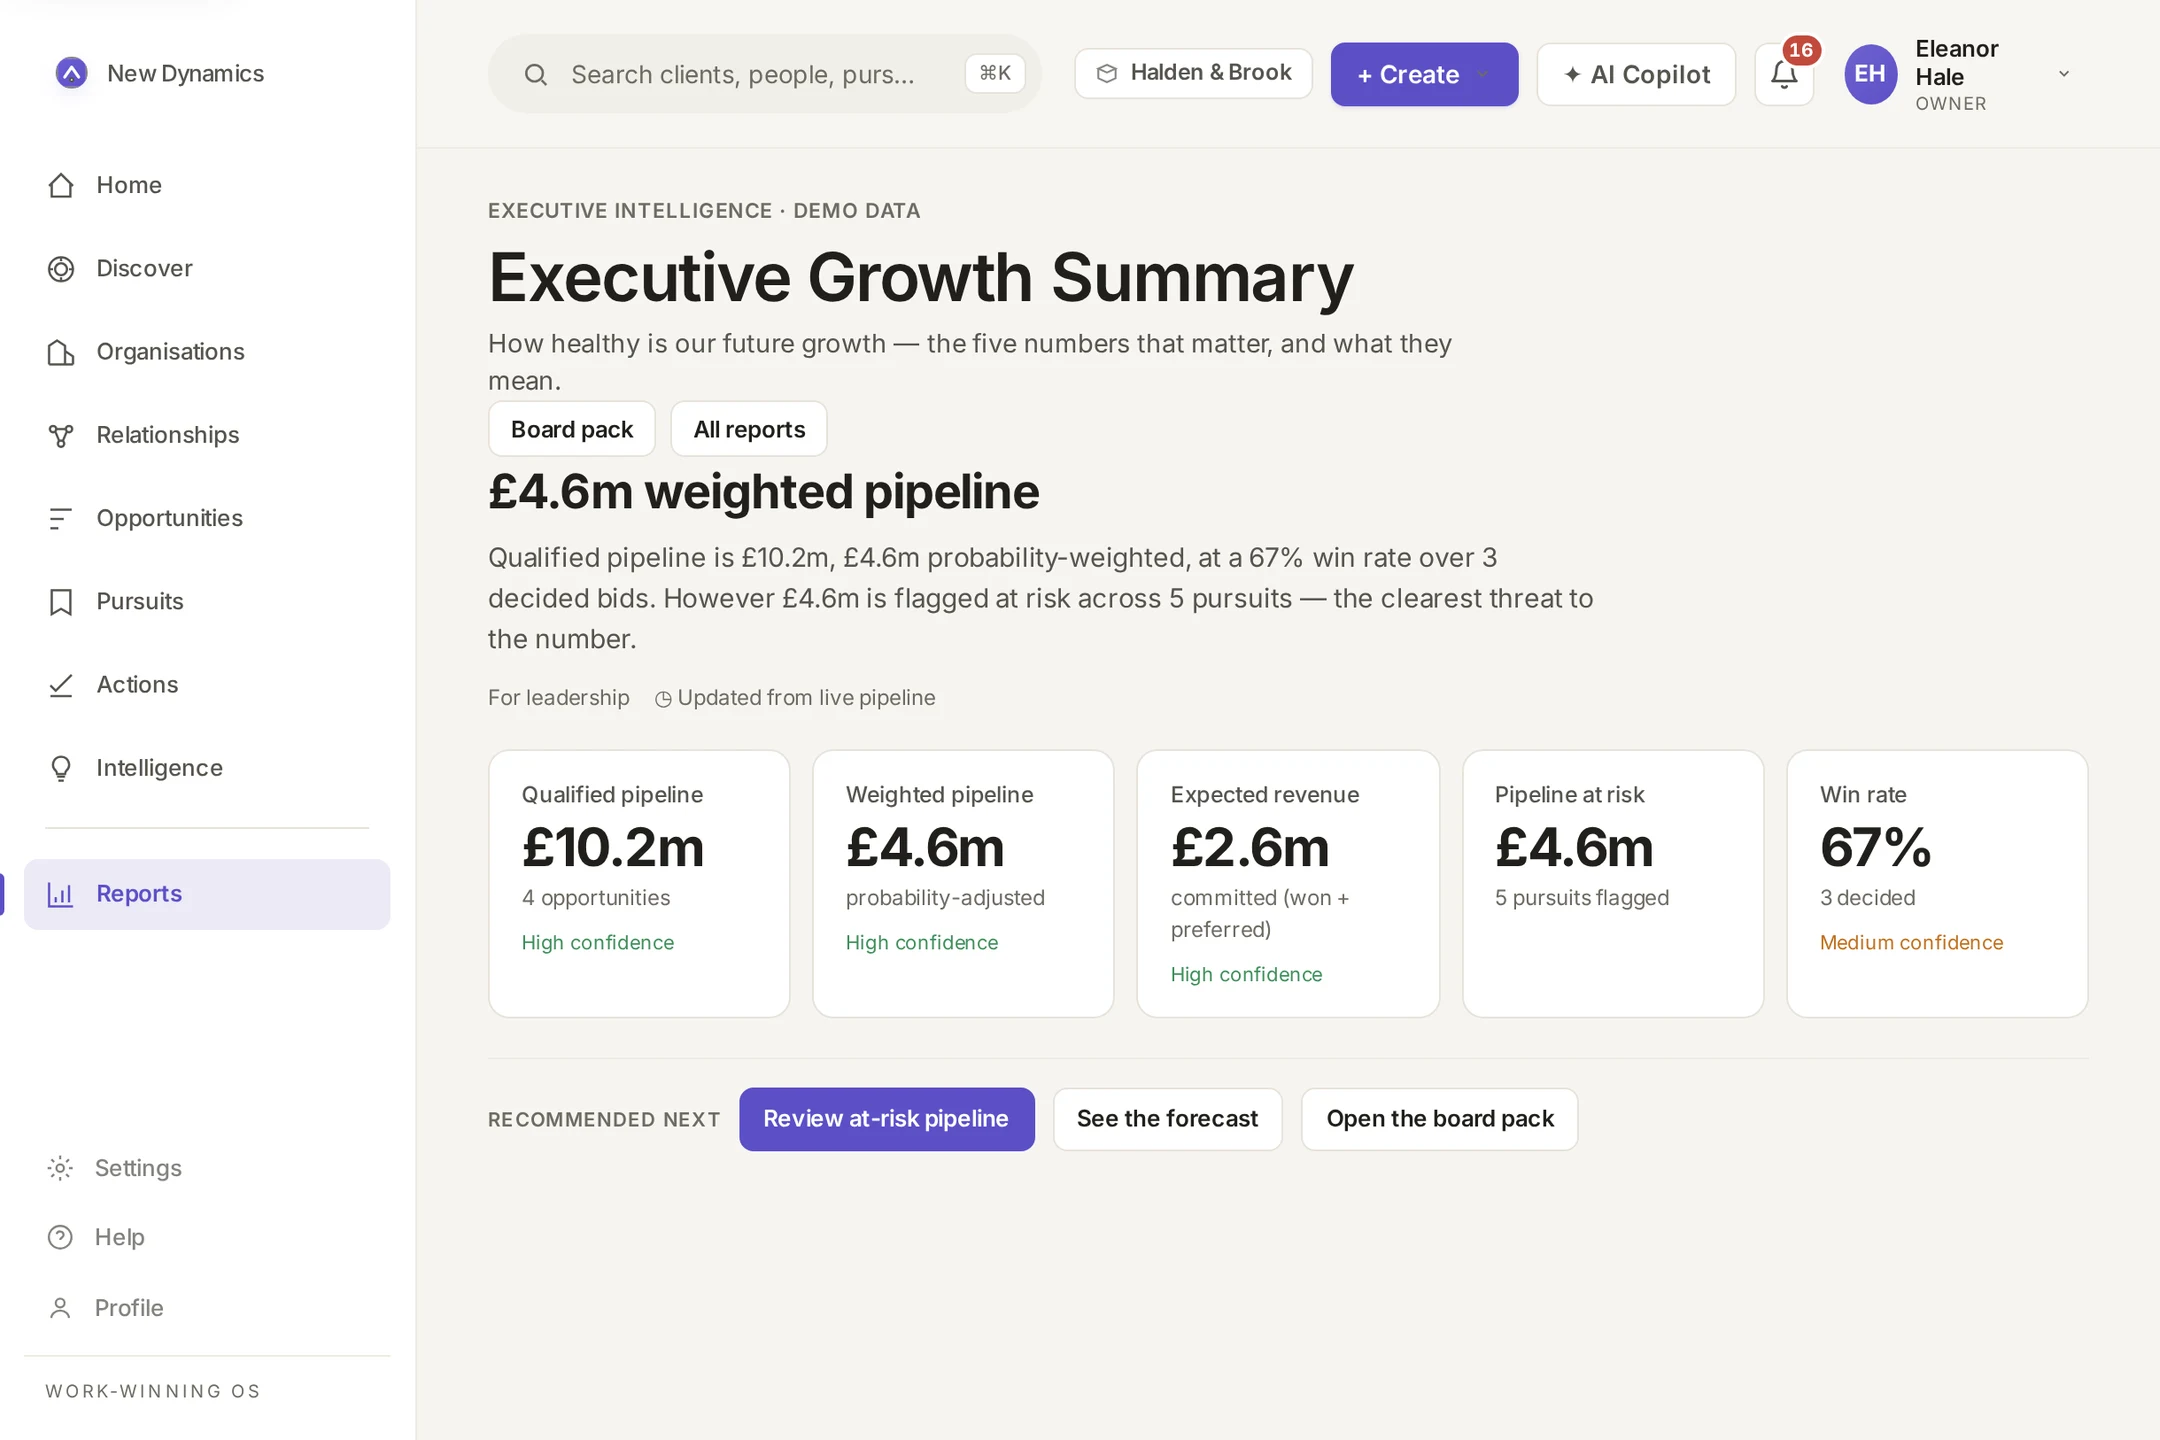
How healthy is our future growth?
The executive summary opens with the answer in a sentence, then the five numbers behind it: qualified pipeline, weighted pipeline, expected revenue, pipeline at risk and win rate. Each carries an honest confidence label, and the clearest threat to the number is named, not buried.
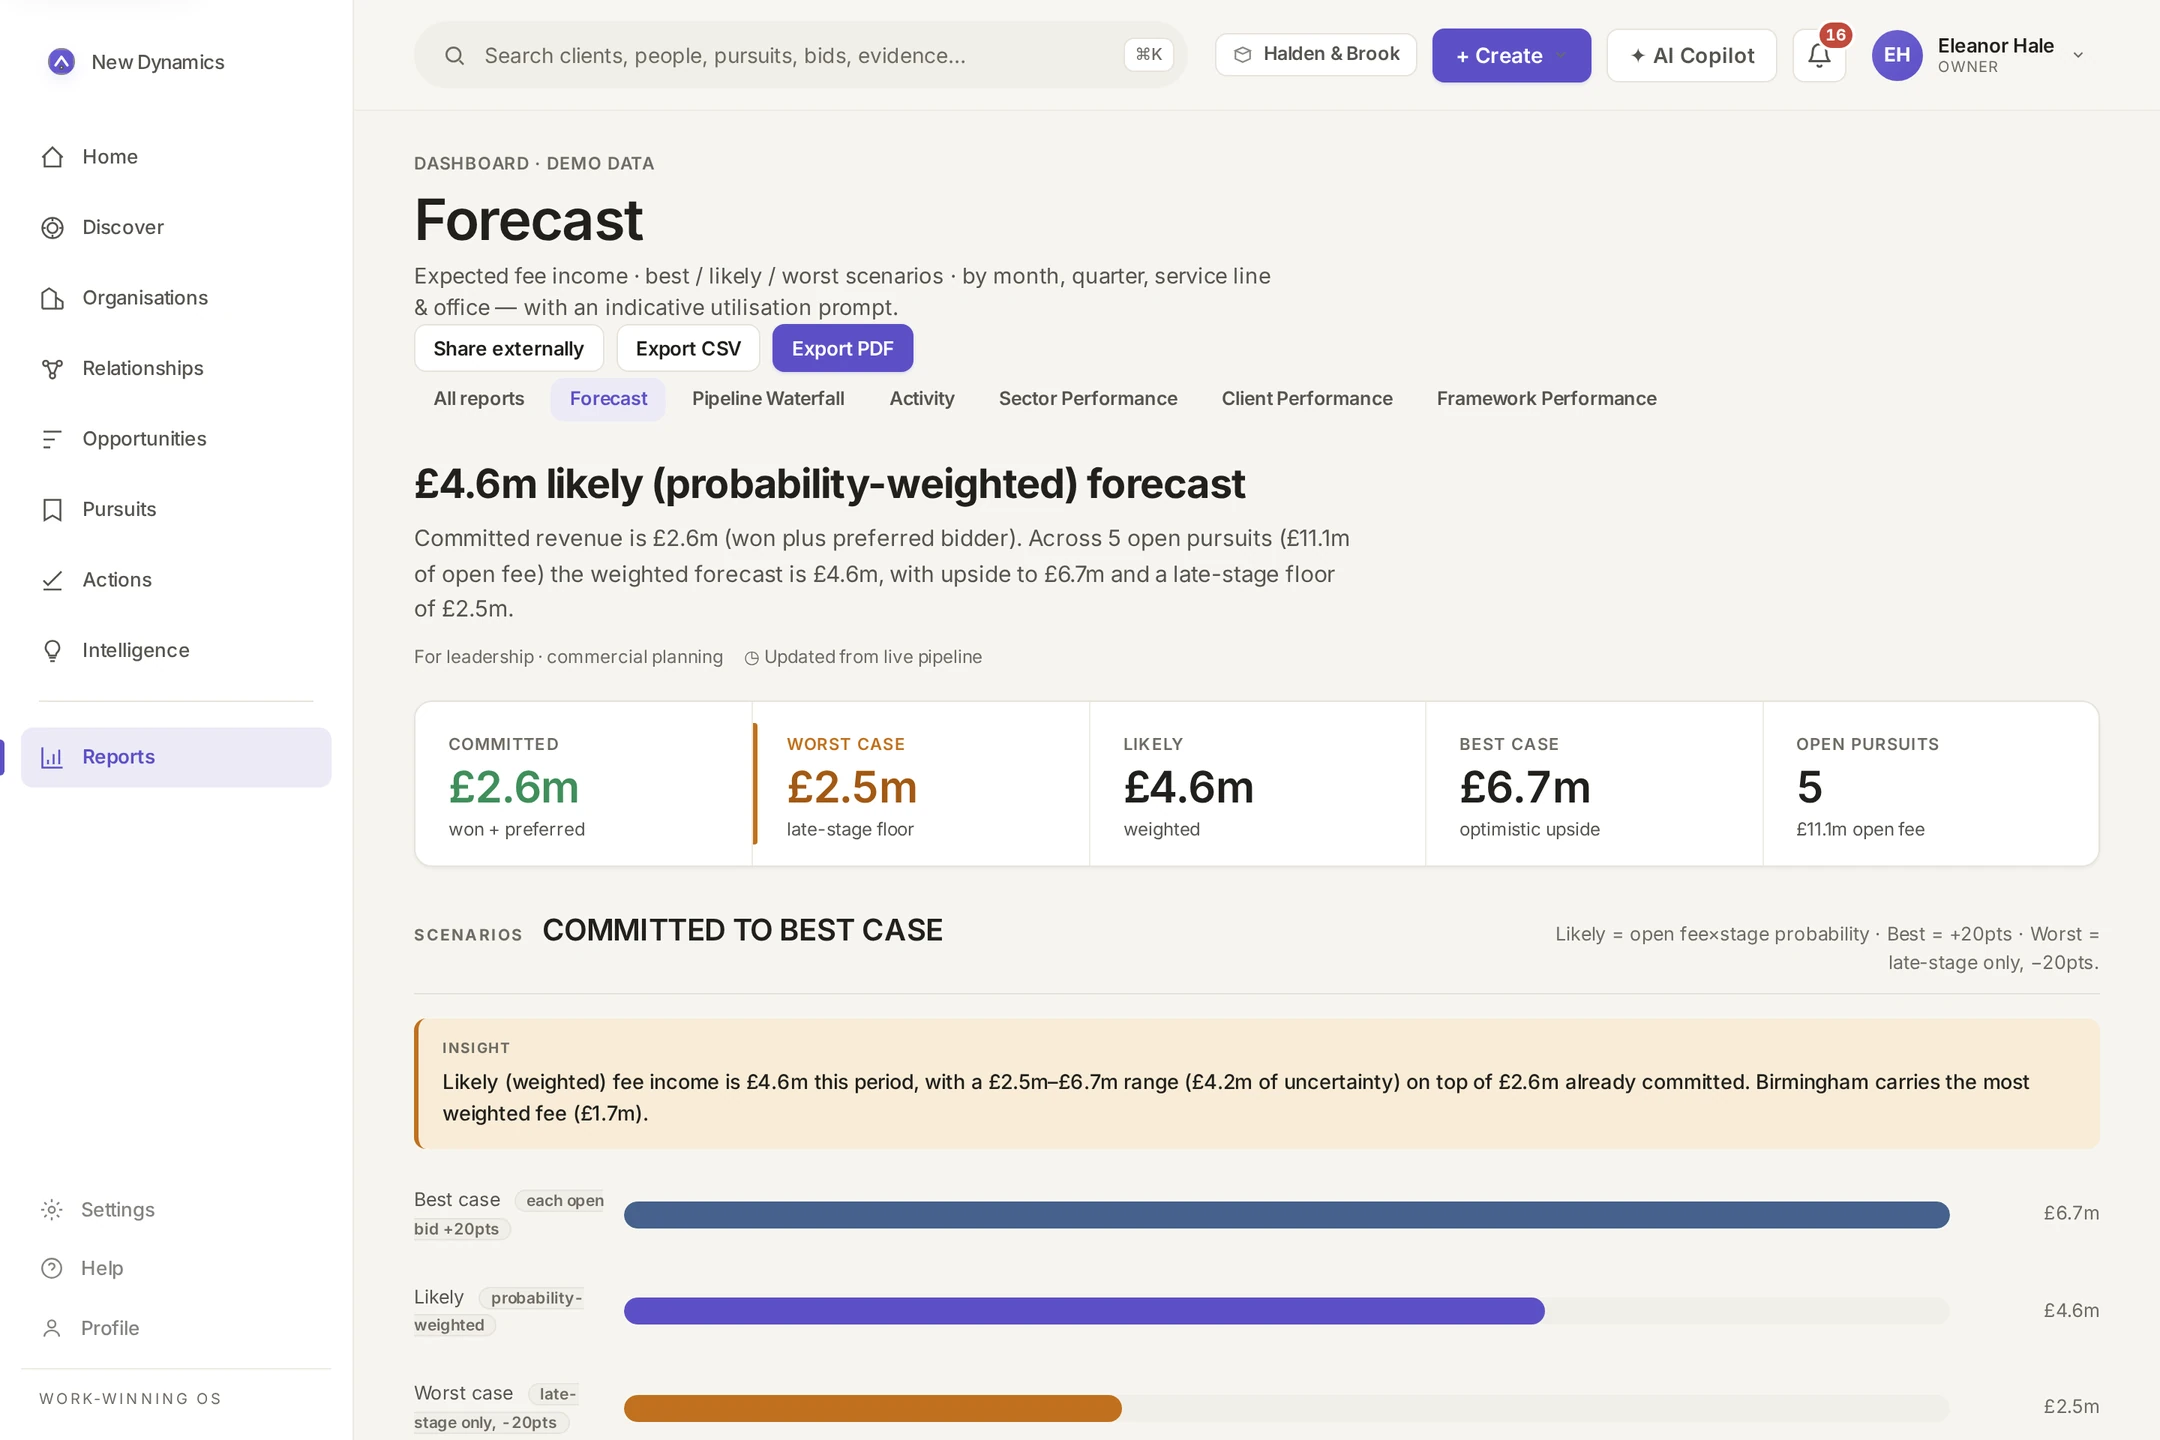
What will fee income actually be this year?
The forecast holds four numbers, not one: committed, a late-stage floor, the probability-weighted likely case and the optimistic upside. Each is derived from live pursuits and stage probabilities, so the range can be interrogated, line by line.
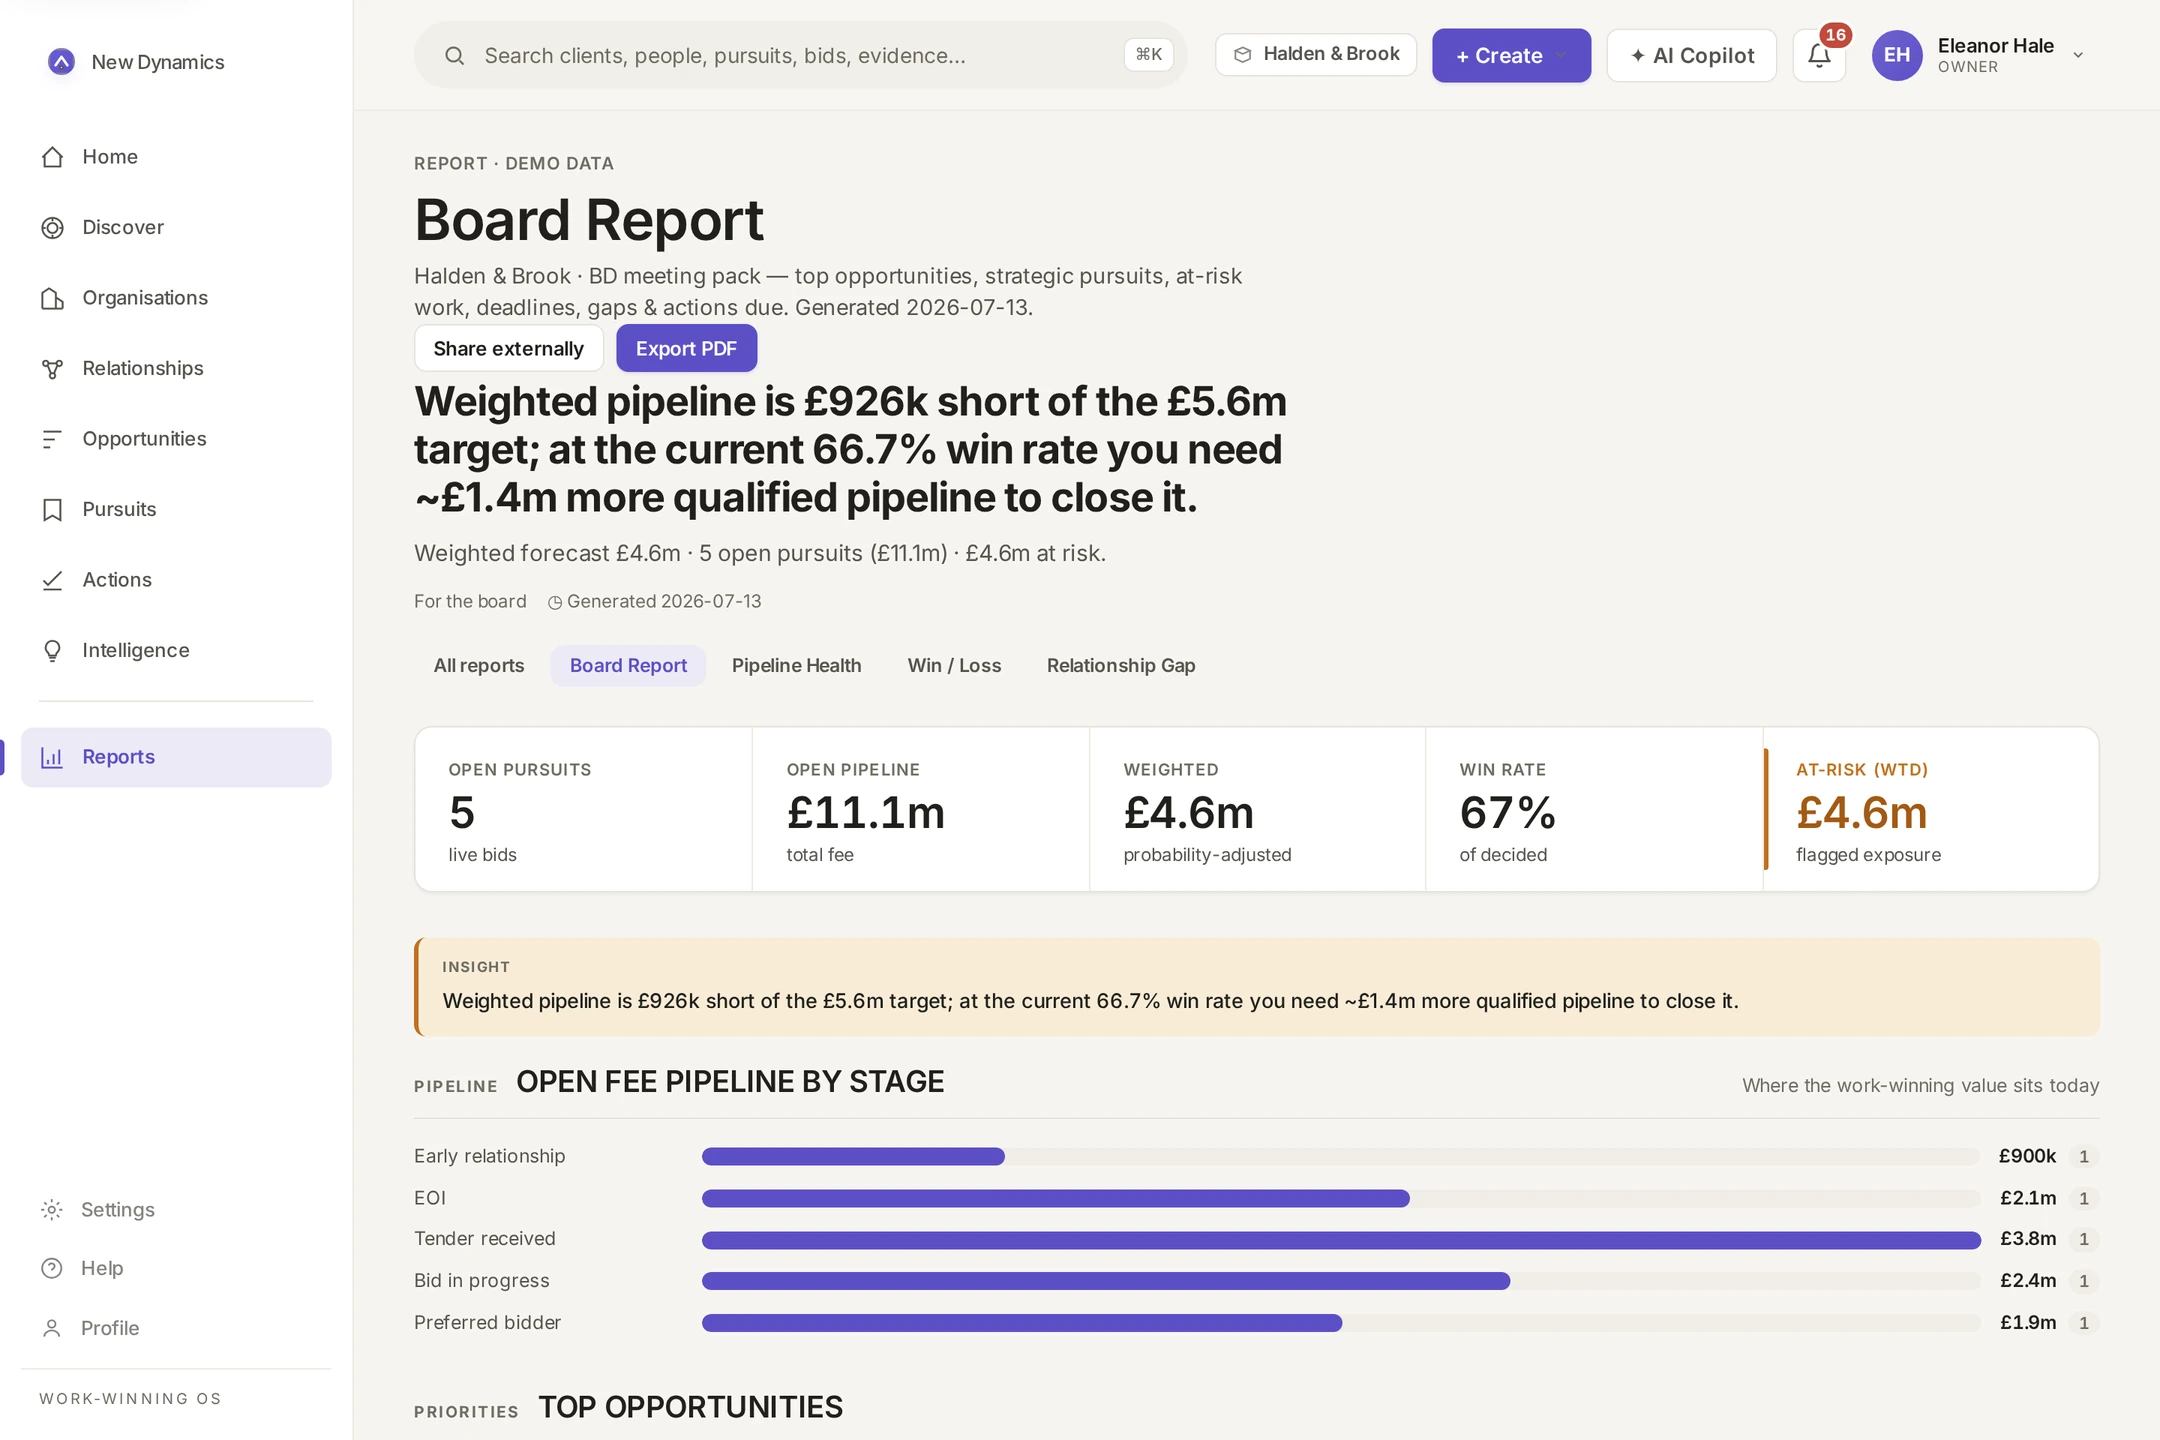
What does the partners' meeting need to see?
The board report assembles top opportunities, strategic pursuits, at-risk fees and actions due, each with a written note on why it matters, and exports to PDF. The story is the same one the teams work in, so nobody argues about whose number is right.
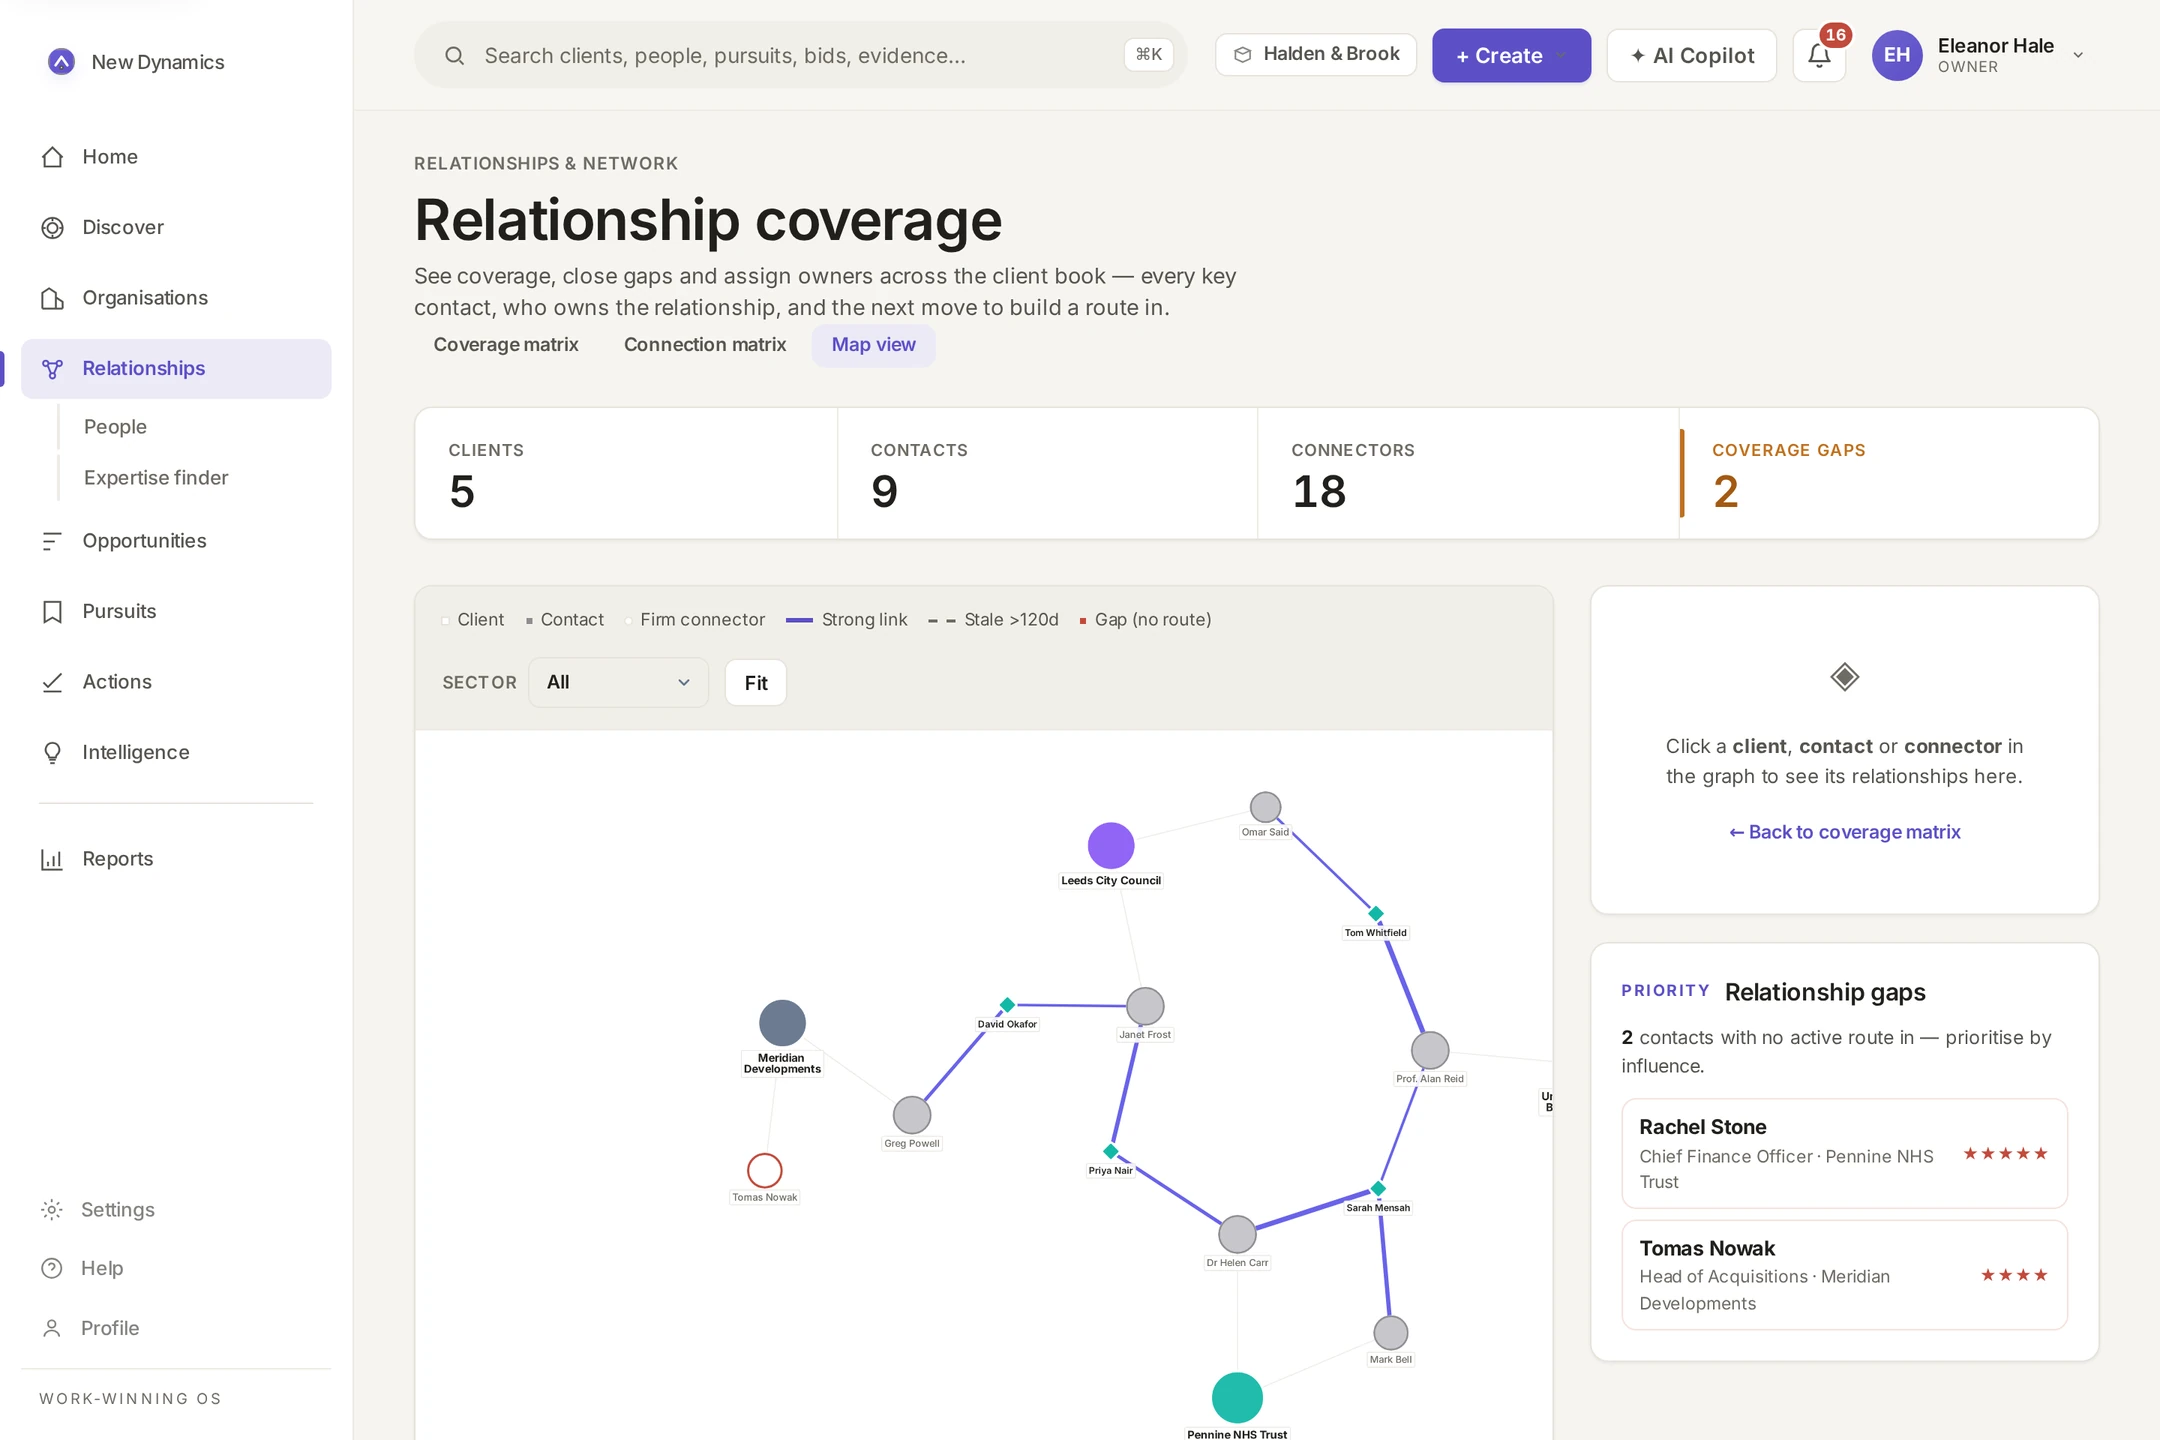
How much of the firm's future hangs on one relationship?
The relationship map shows clients, contacts and the colleagues who connect them. Where a key account depends on a single partner's relationship, you can see it, and decide about it, before the risk decides for you.
You stop
- Taking the pipeline number on faith
- Discovering relationship risk when a partner resigns
- Reading board packs assembled the night before
- Judging BD by anecdote
You get
- A forecast with a floor, a likely case and an upside
- At-risk fees flagged with the reason attached
- Relationship concentration visible on a map
- Win/loss patterns from recorded decisions, not memory
Twenty minutes on the numbers your board actually asks for.
The demonstration walks the forecast, the board report and the exposure map on a realistic workspace for your firm's profile.