TL;DR
- Revenue per employee is a company's revenue for a period divided by its number of employees in that period. Revenue is, in the Cambridge Dictionary's definition, the income that a company receives regularly; the division turns it into a rough measure of how much income the business generates for each person it employs. It is a cousin of productivity, which Cambridge defines as the rate at which a company makes goods judged against the people and materials needed, and which the ONS measures officially as output per hour, output per job and output per worker.
- The formula hides four choices: which revenue, which period, headcount or full-time equivalent, and whether the denominator is the average for the period or the year-end figure, with contractors in or out. Two companies can report different numbers from the same business by choosing differently, so define the calculation once, write it down and keep it stable. A worked example with round numbers shows the arithmetic and how much the FTE choice alone changes the answer.
- The number moves with pricing, product mix, automation, outsourcing and the timing of hiring against revenue, which makes it useless for comparing companies in different industries or business models and useful for watching one company over time. Use it as a trend, a business-model check, a sanity check on the plan and a prompt for the hiring conversation, always paired with a quality or customer measure; never as a target for managers or a reason for headcount cuts on its own.
A board pack shows one number in bold: revenue per employee, up on last year. Half the room reads it as good news about productivity; the other half wonders whether it means the company is understaffed. Both readings can be right, which is the problem with revenue per employee: it is easy to calculate, easy to present and easy to misuse. This article explains what the number means, the formula and the four choices hidden inside it, a worked example, what moves it and what does not, why it cannot be compared across industries, and how to use it well.
Revenue per employee is a thermometer, not a target. The targets that change it belong to teams, with owners and dates. See how New Dynamics Goals & OKRs keep those objectives and their progress in one place, beside the measures they are meant to move.
What revenue per employee means
Revenue per employee is a company's revenue for a period divided by its number of employees in that period. The Cambridge Dictionary defines revenue as “the income that a government or company receives regularly”; dividing it by the number of people employed gives a rough measure of how much income the business generates for each person it employs.
It is often described as a productivity measure, and it is a cousin of one. Cambridge defines productivity as “the rate at which a company or country makes goods, usually judged in connection with the number of people and the amount of materials necessary to produce the goods”. The UK's Office for National Statistics measures labour productivity officially as output per hour worked, output per job and output per worker, where output is value added rather than revenue. Revenue per employee uses revenue instead of value added and employees instead of hours, so it is cruder than the official measures: a business that resells other companies' goods at a thin margin can have high revenue per employee and low value added per employee at the same time.
The formula and its four choices
Revenue per employee = revenue for the period ÷ number of employees in the period.
The division is simple; the choices behind it are not, and two people can produce different numbers from the same business.
- Which revenue. Total revenue as reported, or net of pass-through items such as agency billings, sales taxes and disbursements. Use the revenue figure your accounts report and say which it is.
- Which period. A year is the norm; a trailing twelve months smooths seasonality; a quarter multiplied by four exaggerates it.
- Headcount or full-time equivalent. Headcount counts people; FTE counts hours. A business with many part-time staff has a much higher revenue per FTE than per head. Choose the one that fits how you staff, and use it consistently.
- Average or year-end, contractors in or out. A fast-growing company's year-end headcount is far higher than its average for the year, which pushes the number down; a company that has just cut staff gets the opposite flattery. Use the average for the period. Decide whether long-term contractors count, and apply the rule every year.
Write the definition down once and keep it stable. A change in method looks like a change in performance.

A worked example
The figures are invented and round, to show the arithmetic.
A services company reports revenue of £12 million for the year. It employed 100 people at the start of the year and 140 at the end, an average of 120. Thirty of those are part-time at half hours, so the average FTE is 105.
- Revenue per employee, average headcount: £12,000,000 ÷ 120 = £100,000.
- Revenue per FTE: £12,000,000 ÷ 105 = about £114,000.
- Revenue per employee, year-end headcount: £12,000,000 ÷ 140 = about £86,000.
Three defensible numbers, a third apart, from one business and one year. The choice of denominator matters more than most of the things a manager could do to move the number.
What moves the number, and what does not
| Moves it up | Moves it down |
|---|---|
| Price rises with volume held | Hiring ahead of revenue, as growing companies must |
| A shift to higher-value products or customers | A shift to lower-value or lower-margin work |
| Automation, self-service and software replacing manual work | Bringing outsourced work in-house |
| Outsourcing work to contractors not counted in the denominator | Converting contractors to employees |
| Acquisitions of revenue-heavy, people-light businesses | Investment in functions that earn later: product, sales capacity |
Two things on the list should give pause. Outsourcing raises the number without changing the work; hiring ahead of growth lowers it while building the business. A number that rewards the first and punishes the second is not a measure of management quality. Nor does it say anything about profit: revenue per employee can rise while margins fall.

Why it cannot be compared across industries
Revenue per employee depends on the business model before it depends on the people. A commodity trader, a software company, a consultancy, a supermarket and a care provider will report numbers that differ by orders of magnitude, because revenue per person is a function of what is sold, at what margin, with how much labour in the product. Benchmarks that list figures for large listed companies are no guide for a company of a different size, sector or model, and the temptation to hire or cut towards someone else's number is the most expensive misuse of it.
The useful comparison is with yourself: the same company, the same definition, over time, and with an explanation for each movement.
Five good uses
- A trend. Plot it for five years with the definition fixed and annotate the movements: the price rise, the acquisition, the year of hiring ahead. The line becomes a story about the business model.
- A business-model check. If revenue per employee is falling while revenue grows, the company is becoming more labour-intensive; decide whether that is the plan.
- A sanity check on the plan. Next year's revenue target divided by next year's headcount plan gives an implied revenue per employee; if it is far above anything the company has achieved, one of the two plans is wrong.
- A prompt for the hiring conversation. The number does not say whether to hire; it says what each hire has to earn, on average, to hold it steady, which is a better starting question than “can we afford it”.
- A pair with a quality measure. Beside customer satisfaction, retention, error rates or gross margin, so that a rise driven by overwork or corner-cutting shows up in the other number. Our KPI tracker post explains the paired safeguard.
Three bad uses
- A target for managers. Nobody below the executive team controls the numerator and the denominator together; set as a target, it rewards not hiring.
- A reason for headcount cuts on its own. Cutting people raises the number immediately and costs revenue later; the number cannot see the second part.
- A comparison with another company's figure, unless the industry, model, size and definition all match, which they rarely do.
Putting it on the tracker
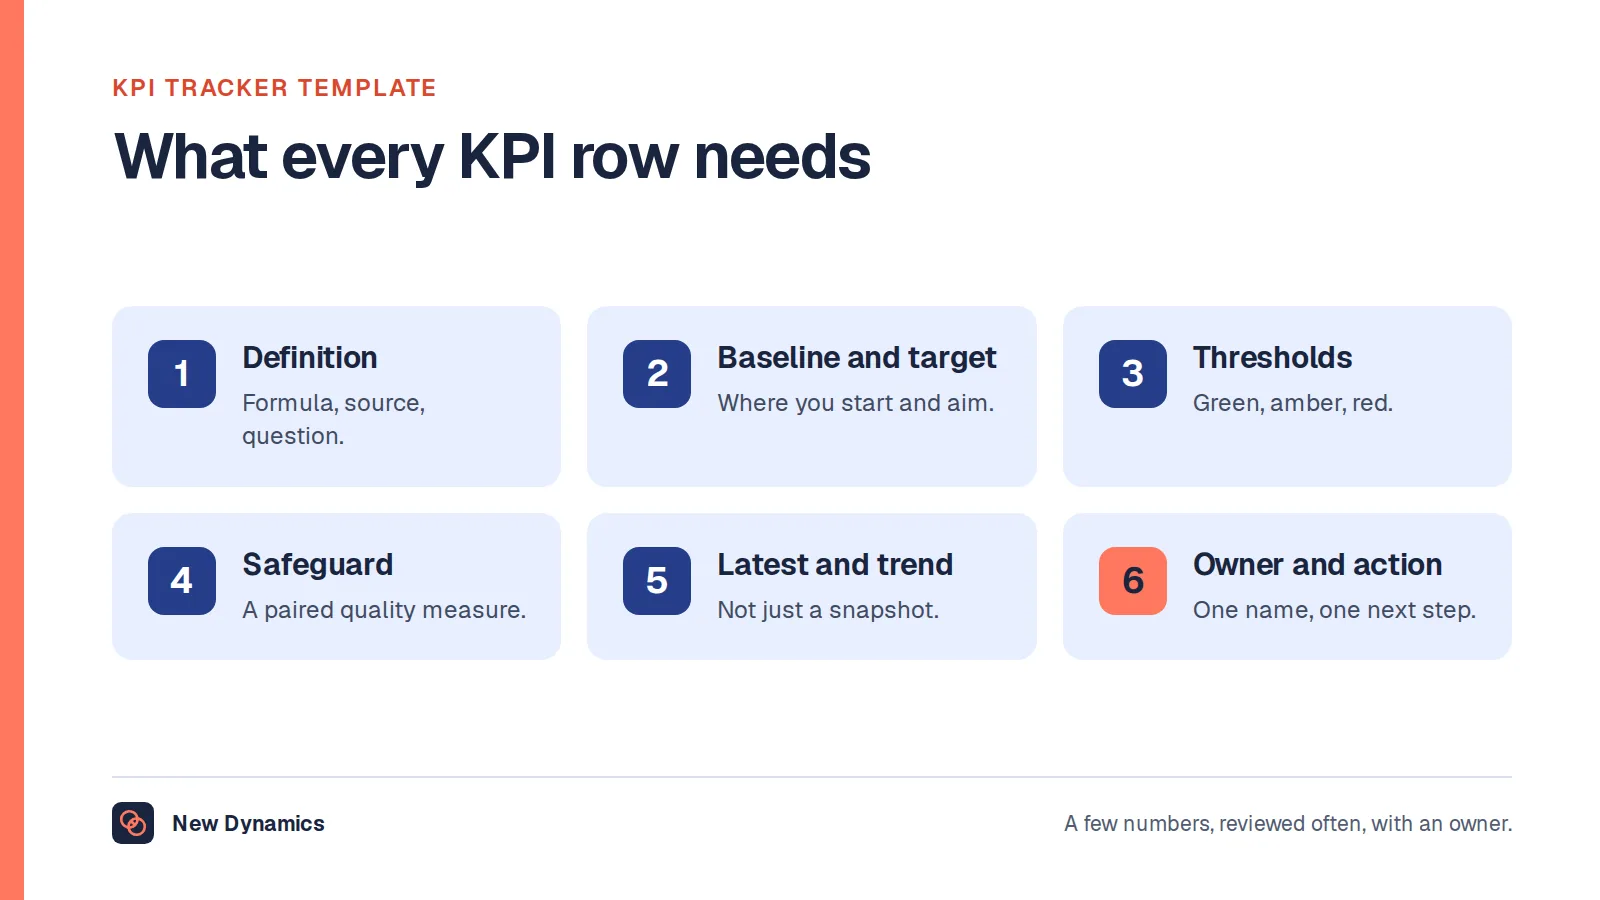
On a KPI tracker, give revenue per employee a written definition covering the four choices, a data source in finance and HR, an owner at executive level, a review rhythm no faster than quarterly, and a paired quality measure. When it moves, write the reason in the tracker before anyone writes a plan. Where the movement calls for change, the change belongs in an objective with an owner and a date, which our guide to OKRs and KPIs sets out.

Frequently asked questions
What is revenue per employee?
A company's revenue for a period divided by its number of employees in that period: a rough measure of how much income the business generates for each person it employs. Revenue is, in the Cambridge definition, the income a company receives regularly. The measure is a crude cousin of productivity, which the ONS measures officially as output per hour, output per job and output per worker.
How do you calculate revenue per employee?
Divide revenue for the period by the number of employees in the period. Decide and write down four things first: which revenue figure, which period, headcount or full-time equivalent, and whether the denominator is the average for the period or the year-end figure and whether contractors are included. Keep the method the same every year.
What is a good revenue per employee?
There is no general answer, because the number depends on the industry, the business model, the margin and the labour in the product before it depends on the people. A good number is one that is rising, or steady by design, for the same company with the same definition over time, alongside healthy quality and margin measures.
Should revenue per employee be a target?
Not for managers below the executive team, because nobody else controls both revenue and headcount, and as a target it rewards not hiring. Use it as a trend and a check, and set targets on the things that move it: pricing, product mix, automation and the timing of hiring.
Is revenue per employee the same as productivity?
No. Productivity in the official sense is output, measured as value added, per hour, job or worker, in the ONS's measures. Revenue per employee uses revenue rather than value added and people rather than hours, so a low-margin reseller can show high revenue per employee and low productivity at the same time.
Your next step: write the definition, then plot five years
- Decide the four choices and write the definition where finance and HR can both see it.
- Calculate the number for the last five years with that definition and annotate each movement.
- Pair it with one quality or margin measure on the tracker.
- Turn any change you want into an objective with an owner and a date, not into a headcount instruction.
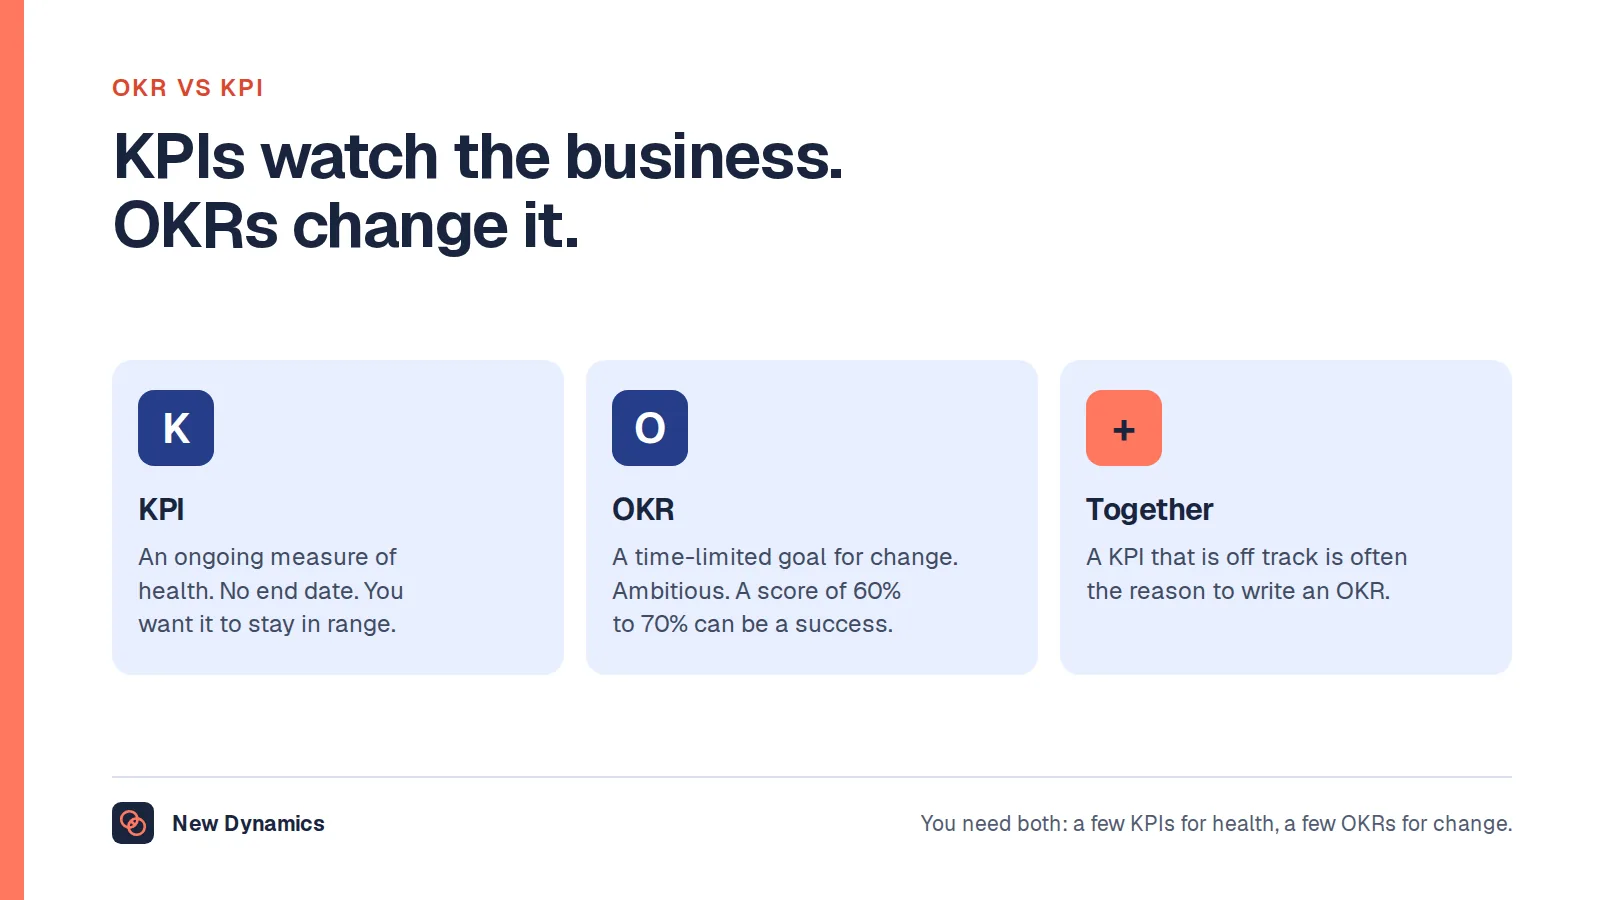
For a way to set the objectives that move a measure like this, read and download our OKR guide. The guide is free to read, and the PDF uses our short download form.
Want measures, objectives and progress reviews in one place, so the board pack number leads to owned work rather than a headcount argument? Book a New Dynamics demo and bring your current board pack. You can also email contact@new-dynamics.com.