TL;DR
- A KPI tracker is a simple record of your key performance indicators: what each one means, its baseline and target, the latest value, who owns it and what you are doing about it.
- A good tracker holds three or four KPIs per team, each with a definition, a data source, an owner, thresholds and a paired quality safeguard. A spreadsheet is enough to start.
- The tracker matters less than the routine around it. Update on a fixed rhythm, look at trends, discuss what the numbers mean and record one action each time.
Many organisations have plenty of numbers. What they lack is a short list of numbers that everyone understands, that somebody owns and that get looked at regularly. A KPI tracker is the modest tool that provides it.
This article gives you a free KPI tracker template, explains the fields that every tracker needs, walks through an example and sets out the review routine that makes the difference between a tracker that gets used and a dashboard that gathers dust.
If you want goals, key results and progress check-ins in one shared place, explore New Dynamics Goals & OKRs.
What is a KPI tracker?
A KPI, or key performance indicator, is a measure that you watch continuously because it tells you whether something important is healthy. A KPI tracker is the place where you record each KPI's definition, baseline, target, latest value, owner and actions.
It can be a spreadsheet, a page in a shared document or a dashboard in a specialist tool. The format matters far less than the discipline.
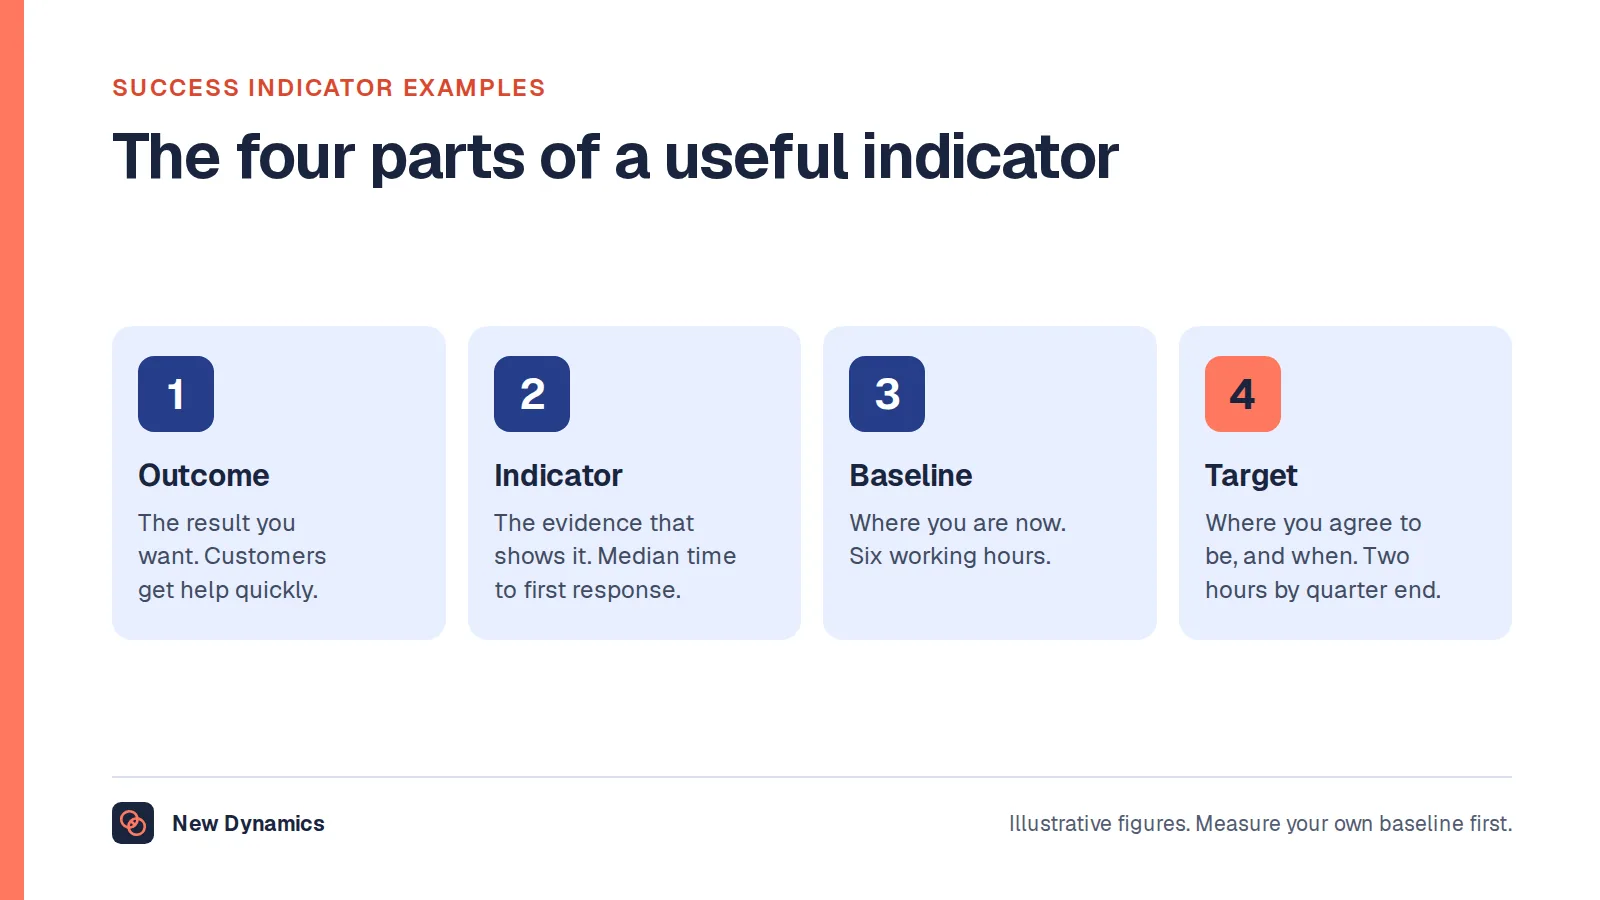
A tracker differs from a dashboard, which displays the numbers, often automatically. A tracker also records what the numbers mean and what you are doing about them. Many teams use both. For choosing the measures themselves, see our success indicator examples, which list 40 by team.
Free KPI tracker template
You can download our free KPI tracker template as an editable CSV that opens in Excel, Google Sheets or any spreadsheet tool. No form is required. It includes the fields below, guidance notes and three example KPIs.
Here is the core layout. Use one row for each KPI.
| Field | Example |
|---|---|
| KPI | First response time |
| Definition | Median working hours from ticket creation to first reply |
| Why it matters | Are customers getting help quickly? |
| Data source | Helpdesk report, excluding automated replies |
| Owner | Support team lead |
| Baseline | 6.0 hours, average of January to March |
| Target | 3.0 hours or less by 30 June |
| Thresholds | Green up to 3 hours, amber 3 to 5, red above 5 |
| Safeguard | Reopened tickets at or below 5% |
| Latest value | 4.2 hours on 5 May, down from 4.9 |
| Commentary | New reply templates launched on 28 April |
| Next action | Train the evening shift on templates. Owner: Sam. By 19 May |
The figures are illustrative.

The fields every KPI tracker needs
A plain definition and a formula. Two people should calculate the same number from the same data. Say what is included and what is excluded.
The question it answers. A KPI earns its place by answering a question that someone cares about. If nobody can name the question, drop the KPI.
A data source. Name the report or the system. A KPI that needs an afternoon of manual work every week will not survive.
An owner. One named person who watches the number, explains its movements and leads the response. Ownership does not mean blame.
A baseline. The GOV.UK Service Manual, in its guidance on setting performance metrics, advises teams to “establish a ‘baseline’ of how your service performs currently” and to judge changes against it.
A target or a healthy range. For most KPIs, a range is more honest than a single figure.
Thresholds. Agree in advance what counts as green, amber and red, and what happens when a KPI turns red. It prevents arguments later.
A safeguard. Pair each speed or volume measure with a quality measure that must not get worse. It is the simplest defence against gaming.
The latest value, and the trend. The Service Manual recommends that you “measure performance continuously as much as possible, rather than taking ‘snapshots’”, because that reveals trends.
Commentary and a next action. A number without an explanation invites guesswork. One or two sentences, and one action with an owner and a date.
How to build your KPI tracker in six steps
- Start from your goals. Ask what the team exists to achieve, and what would tell you that it is working.
- Choose a few KPIs. The Service Manual suggests that you “choose 3 or 4 metrics that would answer the question: ‘is this service working?’” You may keep other metrics for diagnosis, but keep the headline set short.
- Define each one with the people who do the work. They know how the number can mislead.
- Set the baseline before the target. Measure for a few weeks first.
- Decide the rhythm. Weekly for operational measures, monthly for most others, quarterly for slow-moving ones such as retention.
- Put the review in the calendar. A tracker without a meeting is a filing cabinet.

The review routine that makes a tracker work
Fifteen minutes is enough, on a fixed rhythm.
- Look at the trend, not only the latest reading. One bad week is noise. Three in a row is a signal.
- Ask why. The Service Manual says: “To be useful, metrics need to have context.” Compare with previous periods, with similar teams and across segments.
- Check the safeguards. Has anything improved at the expense of something else?
- Decide one action, with an owner and a date. Record it in the tracker.
- Follow up the last action. Did it happen, and did it work?
Every quarter, review the set itself. The Service Manual advises teams to “iterate your metrics as your service changes”. Retire KPIs that no longer prompt decisions, and add one only if you remove another.
KPI tracker example
Here is a small tracker for a customer support team. The figures are illustrative.
| KPI | Baseline | Target | Latest | Status |
|---|---|---|---|---|
| First response time (hours) | 6.0 | 3.0 or less | 4.2 | Amber |
| Customer satisfaction (of 5) | 4.2 | 4.5 or more | 4.4 | Amber |
| Reopened tickets | 7% | 5% or less | 4% | Green |
| First-contact resolution | 71% | 80% or more | 73% | Amber |
Commentary for May: response time is improving since the new templates launched. Satisfaction is rising with it. Reopened tickets, our safeguard, remain low, so the speed is not costing quality. First-contact resolution has barely moved.
Action: review the ten most common reasons for a second contact, and update the help articles for the top three. Owner: Priya. By 30 May.
Four numbers, one paragraph and one action. That is a working KPI tracker.
KPIs, OKRs and the tracker
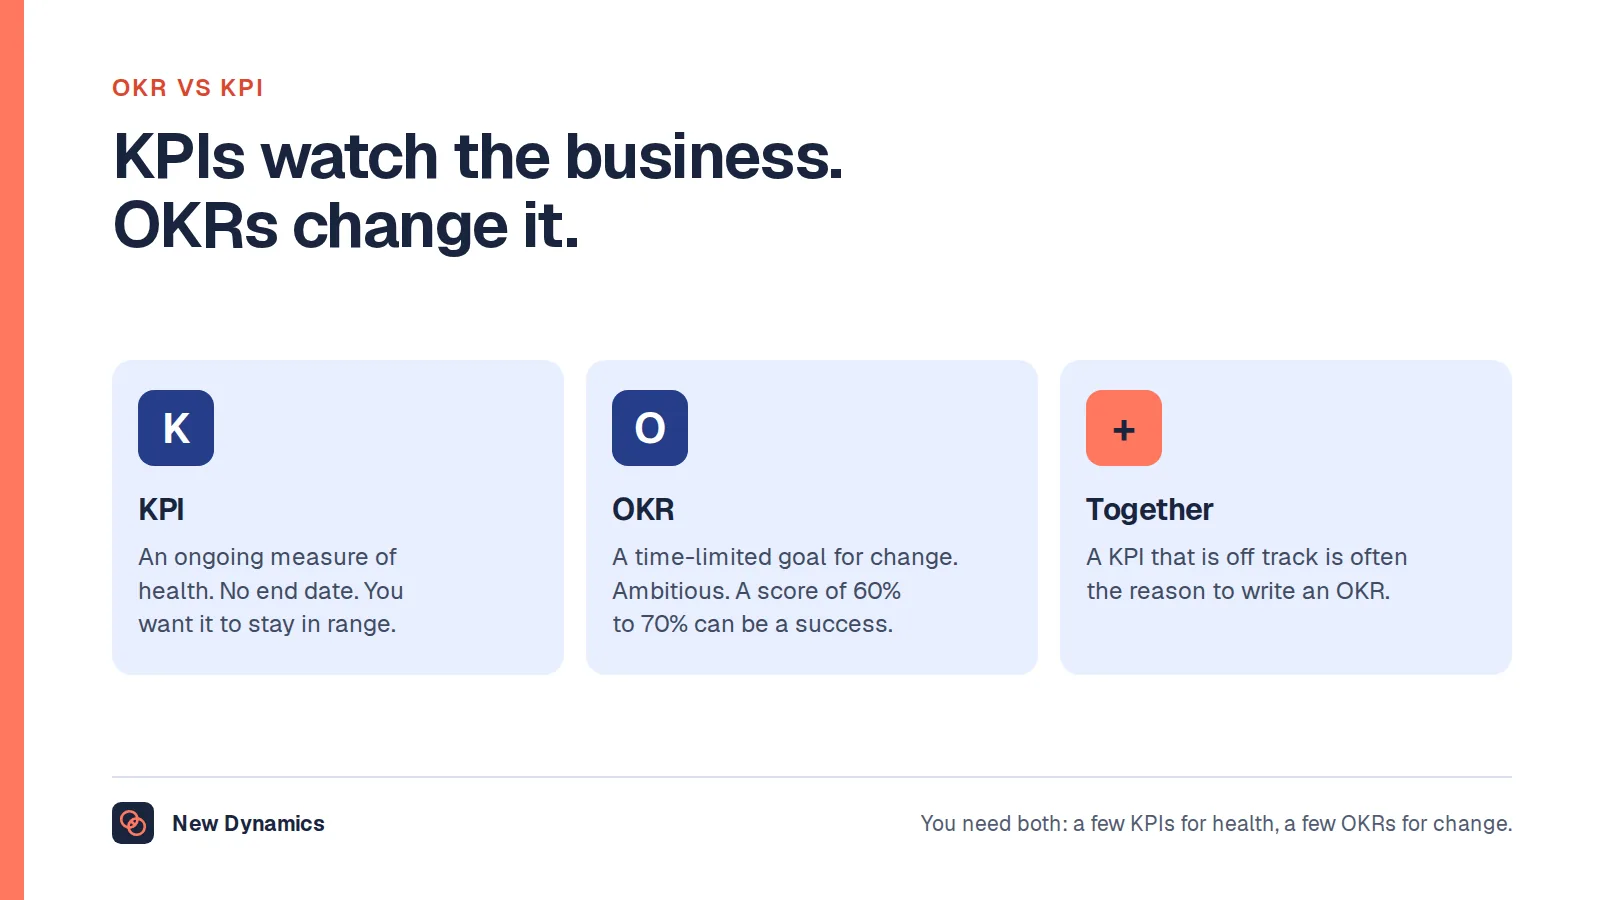
KPIs watch the ongoing health of the business. OKRs describe a change that you want to make this quarter. Google's guide to setting goals with OKRs says that key results should be measurable and “easy to grade with a number”.
The two meet in the tracker. When a KPI sits in amber or red for several periods, it is a candidate for an objective next quarter, with the KPI as one of its key results. We explain the relationship in OKR vs KPI.
Spreadsheet or software?
Start with a spreadsheet. It is quick, free and flexible, and it forces you to think about definitions.
Consider moving to a dedicated tool when:
- updating by hand takes more than an hour or so each cycle;
- several teams need the same numbers, and versions multiply;
- the data already lives in systems that could feed a dashboard automatically;
- leaders need to see how team measures connect to company goals;
- you need an audit trail of who changed what.
Whichever you choose, the fields and the routine stay the same. Software does not fix unclear definitions or missing owners.
Common mistakes with KPI trackers
Too many KPIs. Twenty numbers mean no focus. Keep three or four per team.
No owner. A number that belongs to everybody belongs to nobody.
No baseline. A target without a starting point cannot be judged.
Snapshots in place of trends. One reading can mislead.
Numbers without commentary. People fill the gap with their own stories.
No safeguards. Whatever you measure alone, people will optimise alone.
Using KPIs to punish. If a red number brings blame, people will hide or massage the data. Treat red as a request for help.
Never retiring a KPI. Trackers that only grow end up ignored.

Frequently asked questions
What is a KPI tracker?
A KPI tracker is a record of your key performance indicators. For each KPI it holds a definition, a data source, an owner, a baseline, a target or healthy range, the latest value and trend, a short commentary and the next action. A spreadsheet is enough to start.
How do I create a KPI tracker in Excel or Google Sheets?
Use one row per KPI, with columns for definition, data source, owner, baseline, target, thresholds, safeguard, latest value, commentary and next action. Add a second sheet for the history of values, so that you can chart the trend. Our free template has these fields.
How many KPIs should a team track?
Three or four headline KPIs per team is usually enough. The GOV.UK Service Manual suggests choosing three or four metrics that answer the question “is this service working?”. You can keep other metrics for diagnosis, without reporting all of them.
How often should KPIs be updated?
Match the rhythm to the measure. Operational measures, such as response time, suit weekly updates. Most others suit monthly updates. Slow-moving measures, such as staff retention, suit quarterly updates. Measure continuously where you can, so that you see trends.
What is the difference between a KPI tracker and a KPI dashboard?
A dashboard displays the numbers, often automatically and in charts. A tracker also records definitions, owners, targets, commentary and actions. Many teams use a dashboard for the data and a tracker, or a regular review note, for the meaning and the decisions.
What should a KPI report include?
Include the few KPIs that matter, each with its target, latest value, trend and status, followed by a short commentary on what explains the movement, a check on the quality safeguards and one or two actions with owners and dates.
Your next step: track three numbers for a month
- Download the template, and choose three KPIs that answer “is our work going well?”
- Write a definition, a data source and an owner for each.
- Record a baseline, and agree the thresholds with the team.
- Book a fifteen-minute review every fortnight, and record one action each time.
For a method that connects measures to objectives and key results, read and download our OKR guide. The guide is free to read, and the PDF uses our short download form.
Want objectives, key results and check-ins in one place, connected to feedback and reviews? Book a New Dynamics demo and bring your current measures. You can also email contact@new-dynamics.com.