TL;DR
- The official UK median for a full-time chief executive is £88,350 a year. That is lower than most people expect, because most chief executives run small organisations rather than listed companies.
- The Annual Survey of Hours and Earnings suppresses both the mean and the 90th percentile for this occupation. When the national statistics will not publish the top of a distribution, an average is not a useful number.
- Listed UK companies with more than 250 UK employees must publish a pay ratios table showing chief executive pay against the 25th, 50th and 75th percentile employee.
Ask how much chief executives make and you get two answers that are both true and about a hundred times apart. One comes from an annual report. The other comes from the national statistics.
This article gives the official figures for the UK and the United States, explains why they look nothing like the headlines, describes what a chief executive package contains, and sets out what listed companies have to publish.
Pay decisions belong on evidence, whoever the job belongs to. See how New Dynamics performance reviews bring goals, feedback and development into one fair discussion.
The official UK distribution

The ONS Annual Survey of Hours and Earnings records gross annual pay by four-digit occupation. For chief executives and senior officials working full time, the 2024 revised results give a median of £88,350, up 4.9% on the year, across about 98,000 jobs.
The percentiles matter more than the median:
| Percentile | Gross annual pay |
|---|---|
| 10th | £44,400 |
| 20th | £55,595 |
| 25th | £60,000 |
| 40th | £76,378 |
| 50th (median) | £88,350 |
| 60th | £100,000 |
| 70th | £113,995 |
| 75th | £124,333 |
| 80th | £133,581 |
| 90th | not published |
Two things in that table do the real work. A quarter of full-time chief executives earn under £60,000. And the ONS publishes neither the mean nor the 90th percentile for this occupation, both are suppressed. The survey carries a quality note that the coefficient of variation is between 10% and 20%, which it describes as acceptable, but the top of the distribution is where the sample runs out.
Including part-time and partial-year employees, the median falls to £81,810 across about 111,000 jobs.
The United States
O*NET's profile for chief executives reports median wages of "$102.88 hourly, $213,990 annual".
The gap between that and the UK figure is not mainly a gap in generosity. It reflects what the occupational code captures in each country, how many small organisations call their most senior person a chief executive, and the fact that both figures measure employee pay rather than total remuneration.
Why the average misleads

Four reasons, and they compound.
- The job title spans everything. The same occupational code covers someone running a three-person company and someone running a listed group. Averaging them produces a number that describes neither.
- The distribution has a long tail that the statistics cut off. A suppressed 90th percentile is a statistical way of saying the interesting part cannot be estimated reliably.
- Owner-directors often take dividends rather than salary. Survey figures measure pay for employees, so a founder paying themselves a modest salary appears as a modest salary.
- Headline figures are total remuneration, not salary. The number in a newspaper usually includes bonus, share awards vesting from earlier years, pension and benefits. The number in the pay survey is closer to base pay.
Comparing a headline with a survey median is comparing two different measurements of two different populations.
What a chief executive package contains
- Base salary. The part that pay surveys capture, and usually the smallest share of the total in a large listed company.
- Annual bonus. Paid against measures agreed for the year, often partly deferred.
- Long-term incentive. Shares that vest after a period against longer-term conditions, which is where large headline totals come from.
- Pension. Increasingly aligned with the rate available to the wider workforce.
- Benefits. Car, health cover, and sometimes relocation or tax advice.
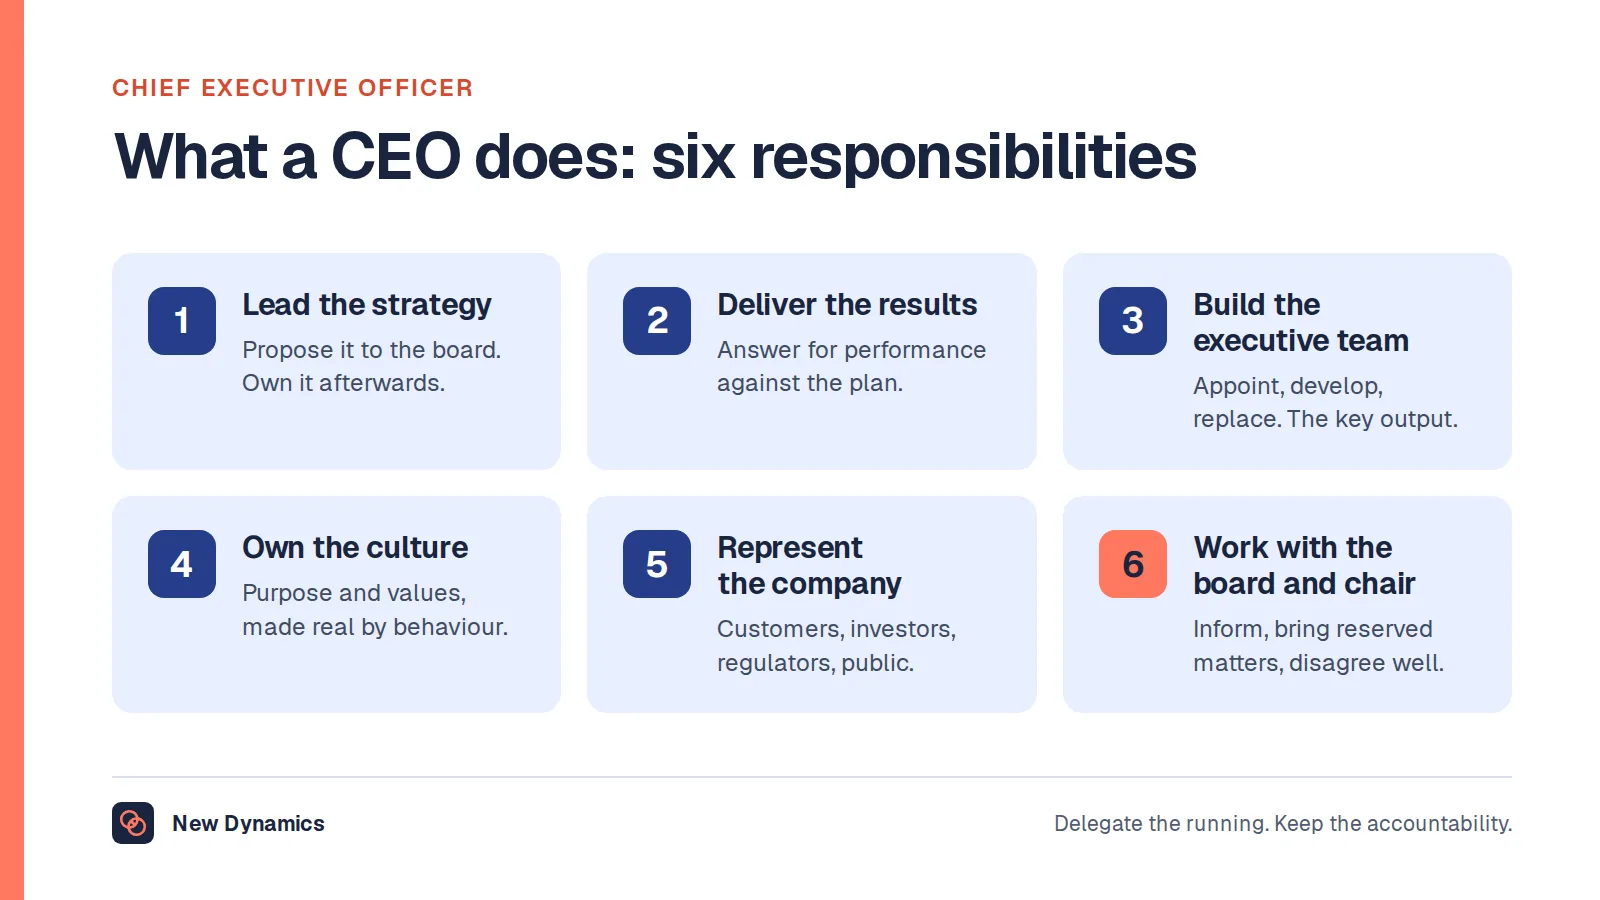
In a small organisation, most of that list does not exist and the package is a salary plus perhaps a bonus. Our CEO job description post covers the accountabilities that the package is supposed to be paying for.
What listed companies must publish
The UK has a statutory answer to "how much does your chief executive make relative to everybody else". The Companies (Miscellaneous Reporting) Regulations insert a requirement for "pay ratio information in relation to the total remuneration of the director undertaking the role of chief executive officer".
The mechanics are worth knowing:
- It applies where "the average number of UK employees of the company is more than 250", counted month by month across the financial year.
- Where the company is a parent, "the pay ratio information must relate to the group and not the company".
- The directors' remuneration report must contain a "pay ratios table" giving the 25th percentile pay ratio, the median pay ratio and the 75th percentile pay ratio, alongside the method used to identify those employees.
That table is the most useful public number in this whole subject, because it is a comparison inside one organisation rather than an average across incomparable ones. This is general information rather than legal advice.
What actually moves the number
- Size. Revenue and headcount predict chief executive pay better than sector does.
- Ownership. Listed, private equity backed, family owned, charity and public sector pay very differently for the same span of control.
- Whether the person owns the company. An owner-director's salary is a tax decision as much as a pay decision.
- Sector. Charity and public sector chief executive pay is usually published, and is far below the commercial equivalent for similar size.
- Where the risk sits. A turnaround or a regulated business carries a premium that a steady-state role does not.
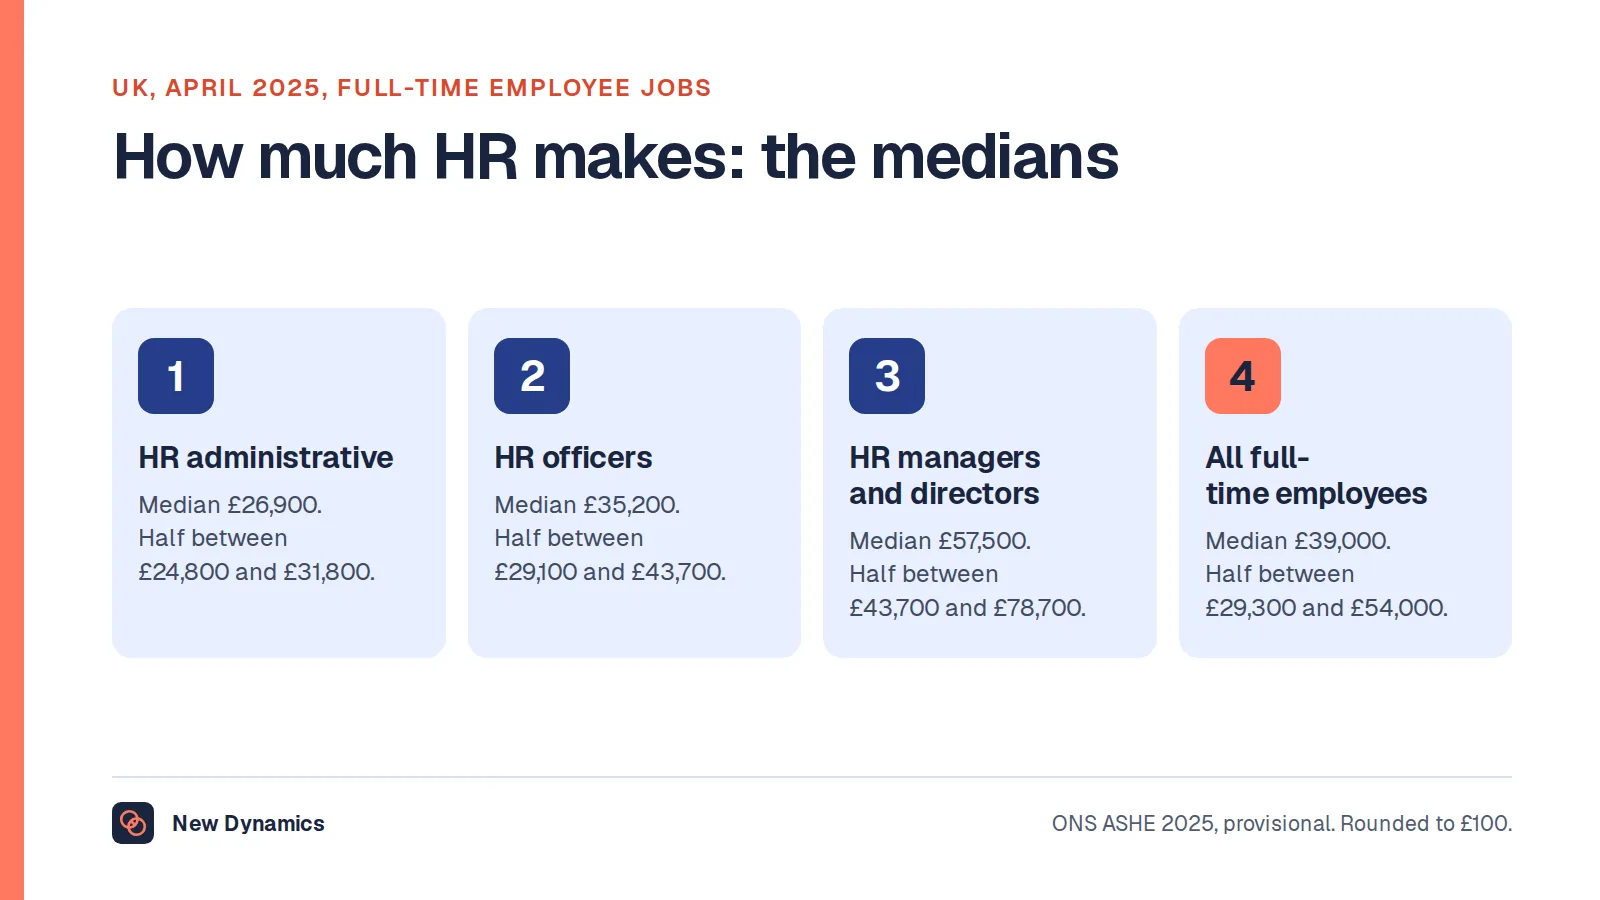
For the same official data applied to HR roles, our HR salary post reads the same survey by job level.
Comparing an offer

- Find the percentile, not the average. Ask where the offer sits in the distribution for organisations of your size.
- Separate the guaranteed from the conditional. Base and pension are certain. Bonus and long-term incentive are not.
- Read the conditions on the incentive, including what happens if you leave, and over what period it vests.
- Ask what the last holder was paid and why it changed, which tells you whether the number reflects the job or the person.
For setting pay in a way you can explain to the people you set it for, read and download our compensation policy guide. The guide is free to read, and the PDF uses our short download form.
Frequently asked questions
How much do CEOs make?
In the UK, the official median for a full-time chief executive is £88,350 gross a year, with a quarter earning under £60,000 and the 75th percentile at £124,333. In the United States, O*NET reports median wages of $213,990 a year. Headline figures for large listed companies are far higher because they measure total remuneration including share awards.
What is a typical CEO salary?
There is no typical figure, because the occupation includes both owner-managers of very small companies and chief executives of large groups. The most useful question is which percentile an offer sits at for organisations of a comparable size and ownership type.
Why is the official average CEO salary so low?
Because most chief executives run small organisations. The national statistics also suppress both the mean and the 90th percentile for this occupation, so the largest packages are excluded from the published figures rather than averaged into them.
What is a CEO pay ratio?
It is the ratio of the chief executive's total remuneration to the pay of the 25th percentile, median and 75th percentile UK employee. Quoted UK companies with more than 250 UK employees must publish a pay ratios table in the directors' remuneration report, together with the method used.
What is included in a CEO package?
Base salary, an annual bonus, a long-term incentive paid in shares, pension and benefits. In a small organisation the package is usually salary and perhaps a bonus, which is why survey figures and newspaper figures describe different worlds.
Do CEO salaries include bonuses and shares?
Pay survey figures are gross pay for employees and are closer to base salary. The large totals reported in the press are total remuneration, which adds bonus, vested share awards, pension and benefits, so the two numbers are not comparable.
Your next step: find the percentile
- Decide which population the comparison should use: size, sector and ownership.
- Read the offer against the distribution rather than against an average.
- Split the package into guaranteed pay and conditional pay before comparing.
- If you are setting the pay, write down the reasoning you would be willing to publish.
Want pay decisions that rest on a record rather than a recollection? Book a New Dynamics demo and bring your current pay review process. You can also email contact@new-dynamics.com.