TL;DR
- Almost no HR metric has an agreed definition, so two organisations quoting the same turnover figure are usually measuring different things.
- Two UK measures are fully specified: the gender pay gap and the CEO pay ratio. Both name the population, the date, the calculation and where to publish it, which is what a usable metric looks like.
- The fix is not more metrics. It is publishing the formula next to the number, so that the definition decisions are visible rather than buried.
A board asks for turnover. Someone produces 14%. Nobody asks whether that includes fixed-term endings, whether it is measured against opening or average headcount, or whether the two people who transferred to a subsidiary are in it.
This article explains why most HR metrics cannot be compared, what the two fully specified UK measures look like, which metrics are worth keeping, and how to build a dashboard that survives a question.
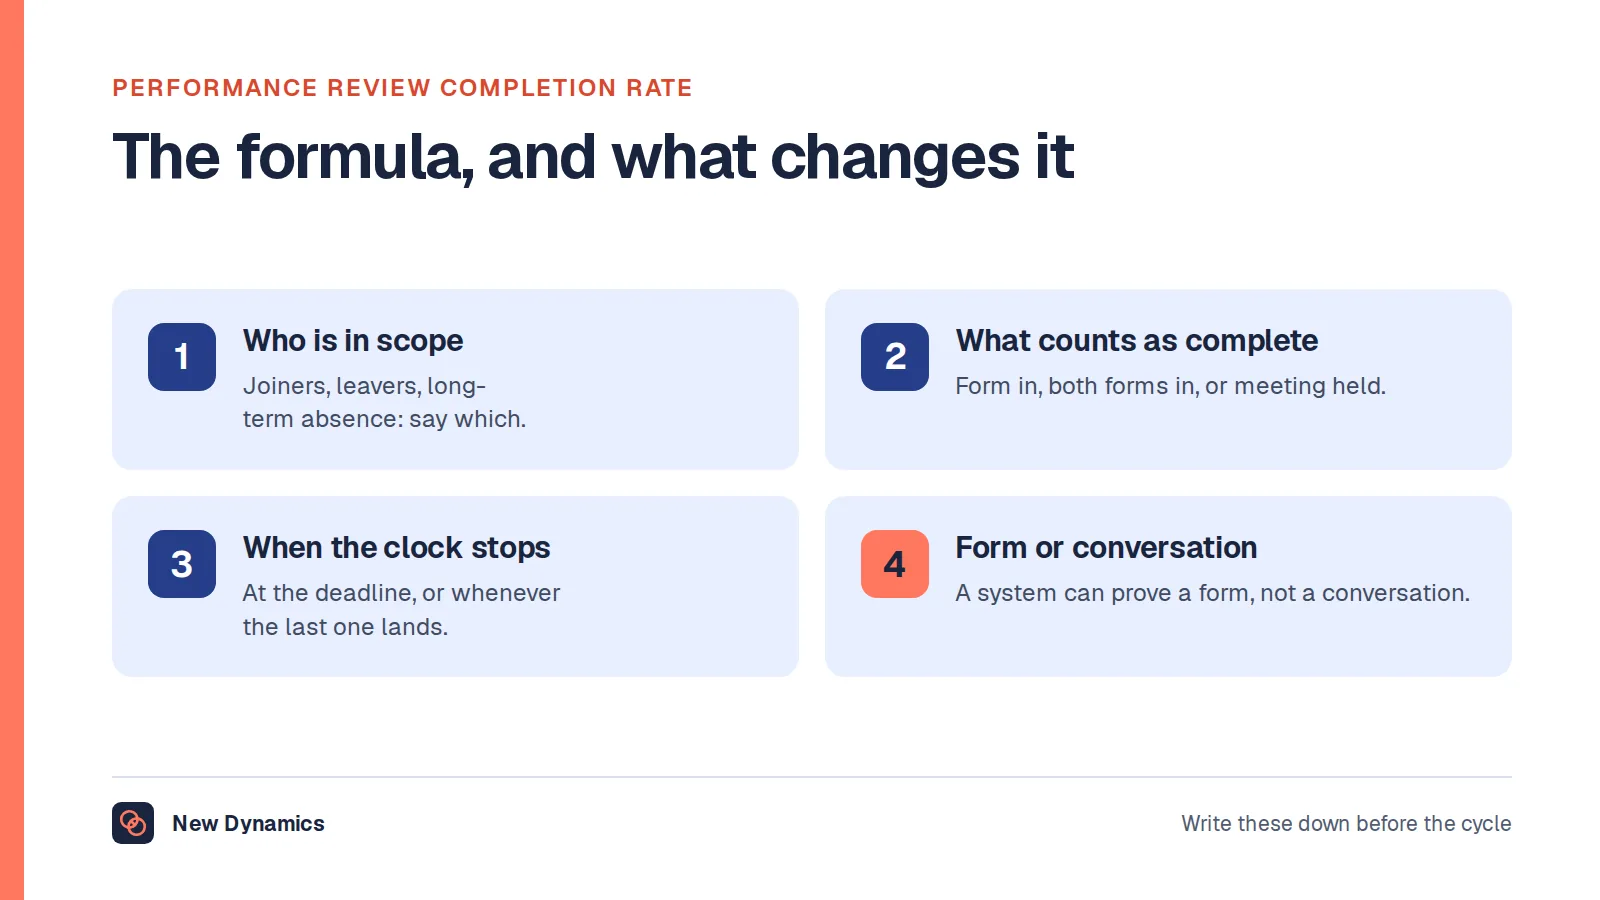
Measures are only useful when they attach to something someone is trying to change. See how New Dynamics goals and OKRs keep that link visible. For the measure most HR teams are asked for first, see our guide to the performance review completion rate: how to calculate it and what it hides.
One measure is routinely mistaken for a legal test: our post on pay equity separates the pay gap from equal pay. For the objectives these measures should serve, see our post on HR goals.
Why most of them cannot be compared

Every HR metric hides three decisions:
- Who counts. Employees only, or workers and contractors? Leavers on fixed-term contracts? People who transferred within a group?
- Over what period, and measured at which point in it.
- Against which denominator, opening headcount, closing headcount, or the average.
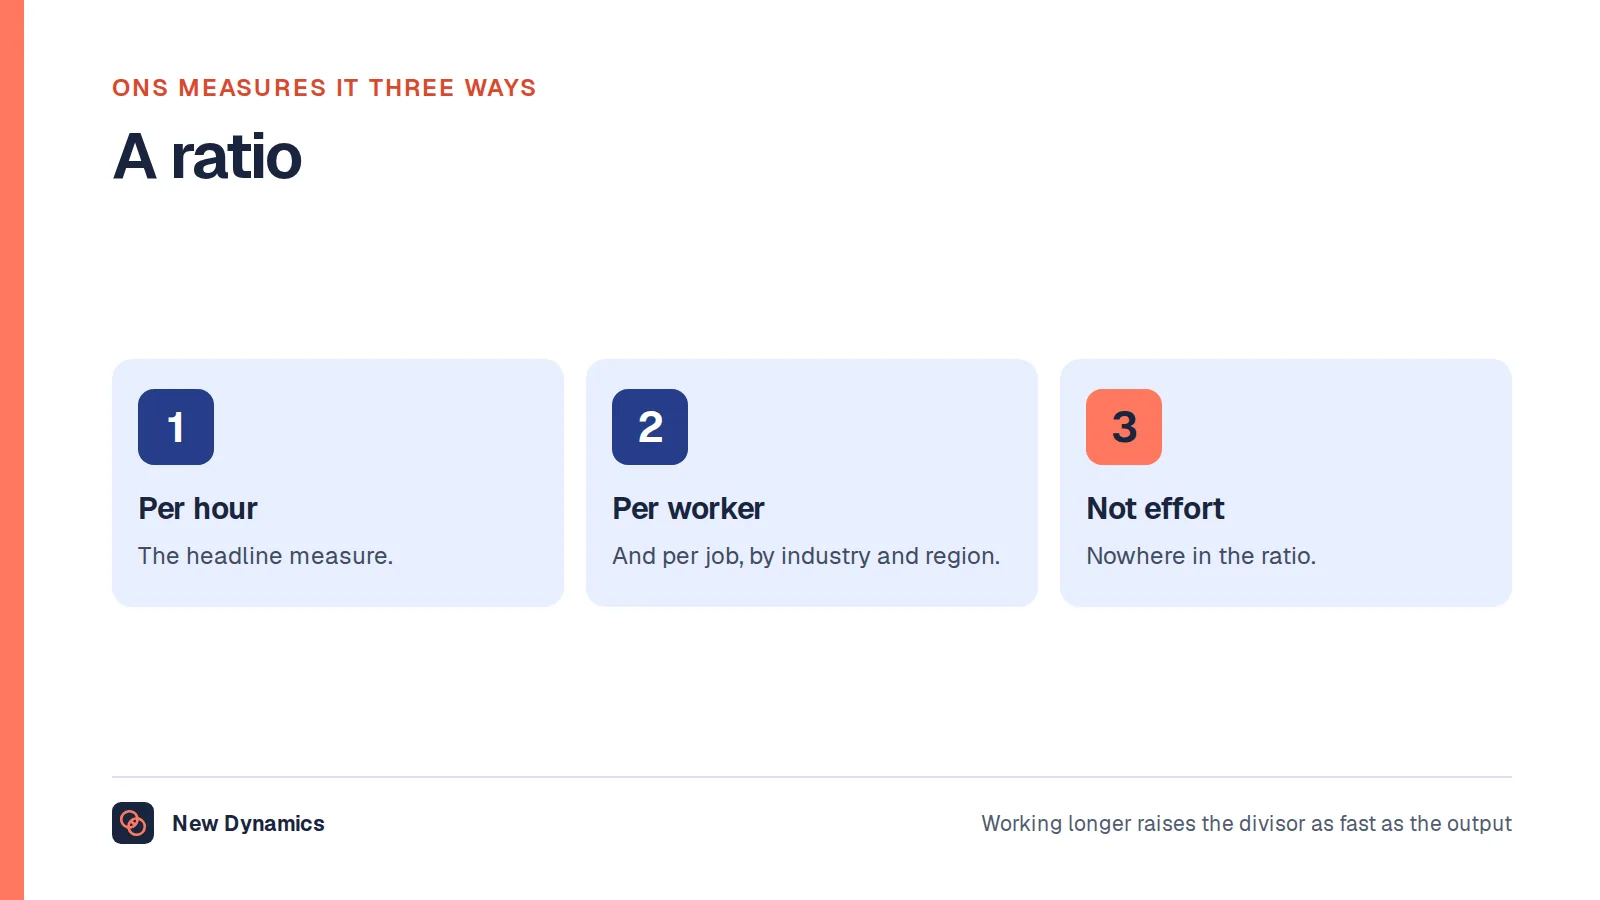
Change any one and the number moves, often by several points. Since no standard body publishes definitions for turnover, time to hire, absence rate or cost per hire, every organisation answers those three questions privately and then compares the result with somebody who answered them differently.
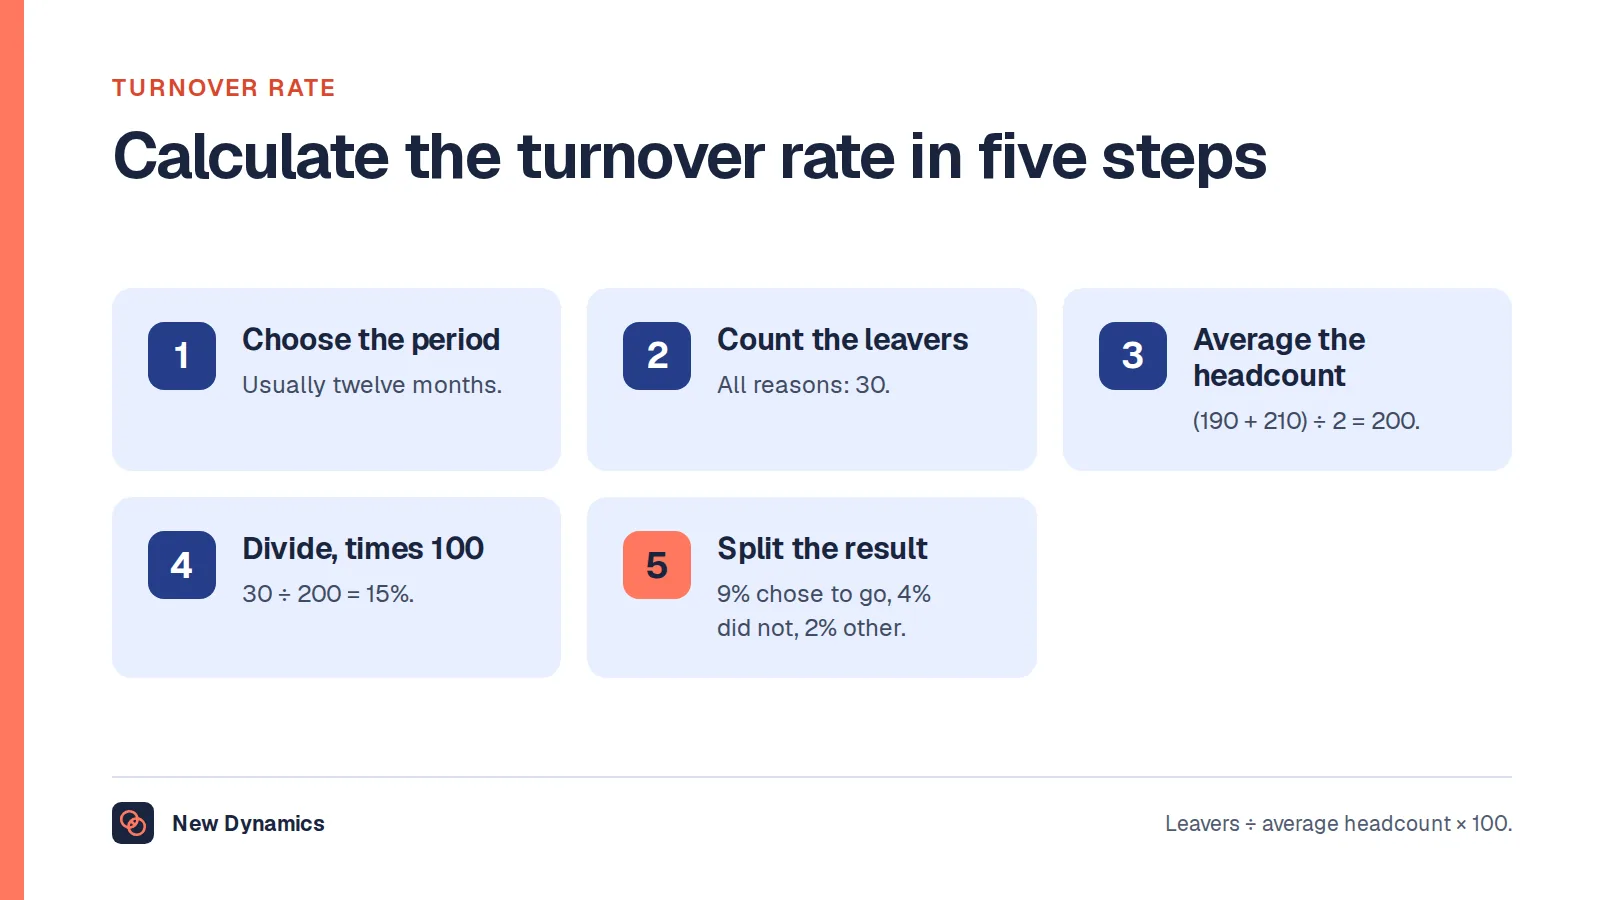
Our turnover rate post sets out one defensible way to do it; the important part is publishing which way you chose.
The two that are fully specified
The UK does have measures with a published method, and they are worth studying as models.
The gender pay gap. GOV.UK's statutory guidance for employers specifies everything. Who reports: "any employer with 250 or more employees on a specific date each year (the 'snapshot date')". When: "within a year of your snapshot date", with the snapshot being "31 March for most public authority employers, and 5 April for everybody else". Which entity: "each separate 'legal entity', if you are part of an organisation or group with more than one legal entity". Even the headcount rule is settled, it "is of the number of individual employees you have, not full-time equivalents", including people "on leave" and "some self-employed people, if they must perform the work themselves".
And the calculation itself is six figures: the "mean (average) and median gender pay gap for hourly pay and bonus pay", the "percentage of men and women in each hourly pay quarter", and the "percentage of men and women receiving bonus pay". Different rules apply to public authorities in Scotland and Wales.
The CEO pay ratio. The Companies (Miscellaneous Reporting) Regulations require a "pay ratios table" giving the 25th percentile, median and 75th percentile pay ratios "and the method" used to determine them, where "the average number of UK employees of the company is more than 250".
Note what both do: name the population, the date, the formula, and the place to publish. That is the whole discipline, and nothing stops you applying it to a metric nobody legislates.
The metrics worth keeping

Movement. Turnover, and separately the turnover of people you wanted to keep. The second is the one that matters and almost nobody reports it, because it requires a judgement somebody has to own.
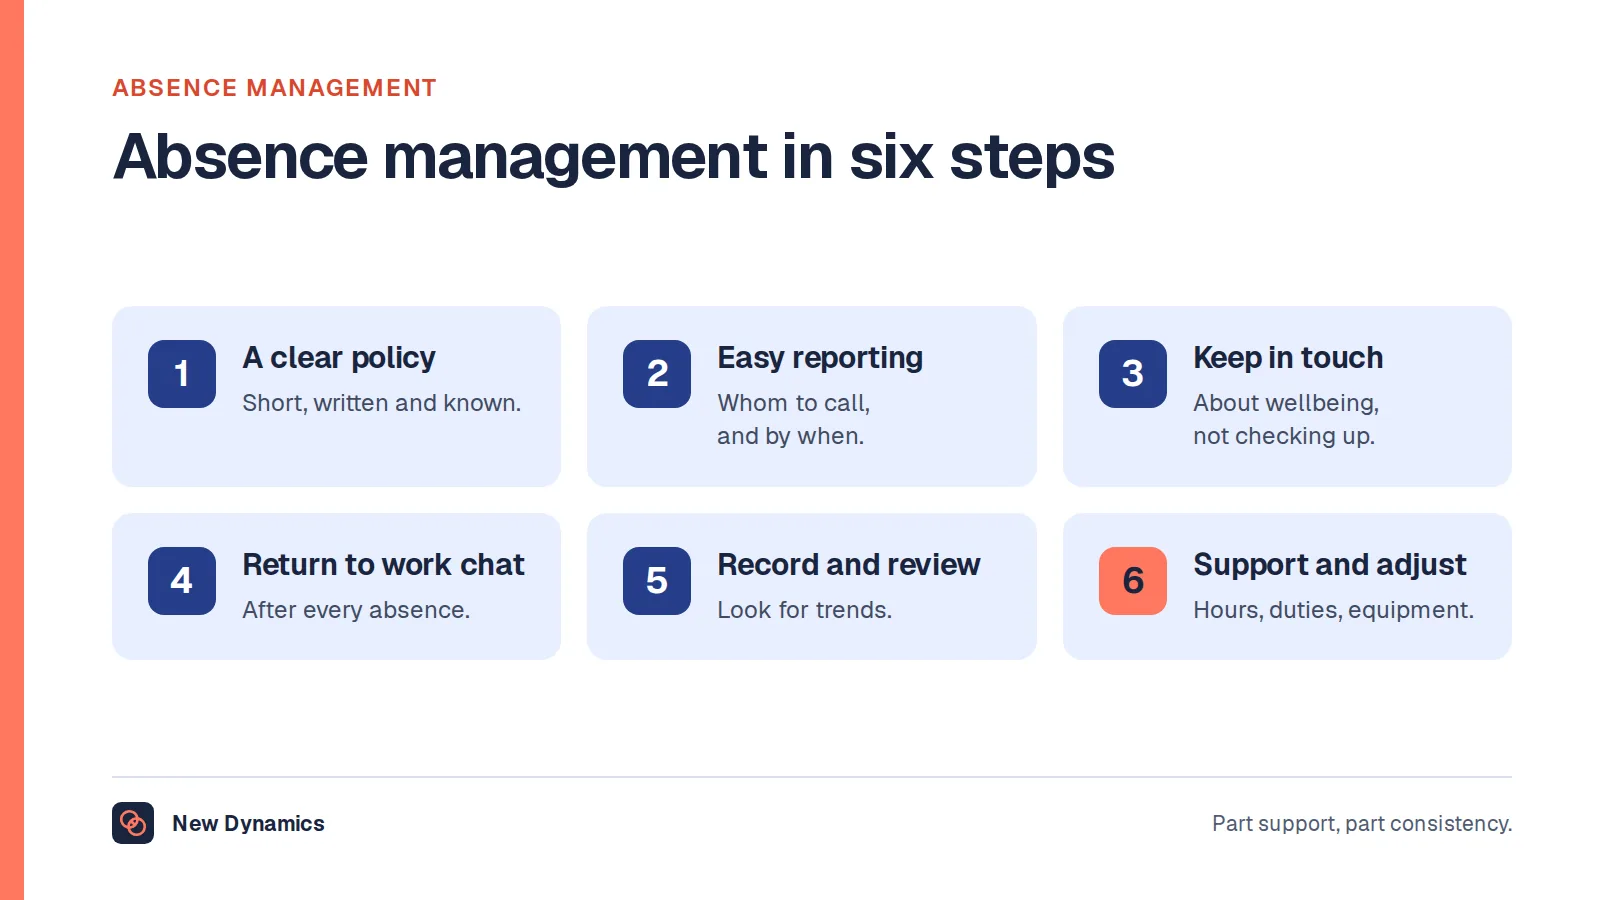
Absence. Days lost and, separately, the pattern, short frequent absences behave differently from long ones. Our absence management post covers handling both.
Hiring. Time to hire and offer acceptance rate. Time to hire hides the biggest definition decision of all: does the clock start at the vacancy request, the advert, or the first application?
Progression. Internal fill rate, and who is moving. A single number here can conceal that all the movement is in one function.
Completion. Whether objectives exist, one-to-ones happened and reviews were written. Dull, checkable, and the best predictor of whether anything else you measure means anything.
Each of those needs its formula written down next to it. That is the difference between a metric and a number.
Measure conditions, not only outcomes
Outcome metrics tell you something happened; condition metrics tell you why. HSE's Support standard is written as observable states rather than scores: employees "receive regular and constructive feedback", they "know what support is available and how and when to access it", and there are systems "to enable and encourage managers to support their staff".
Those can be answered yes or no for each team, which makes them more actionable than a satisfaction score, and they point at a decision rather than a mood.
A dashboard that survives a question

- Publish the formula beside the number, including the population and the denominator.
- Keep the definition fixed, and if you change it, restate the history rather than quietly rebasing.
- Show the distribution, not just the average, because the average hides the part worth acting on.
- Attach an owner and a decision to each metric. A measure nobody would act on is reporting, not management.
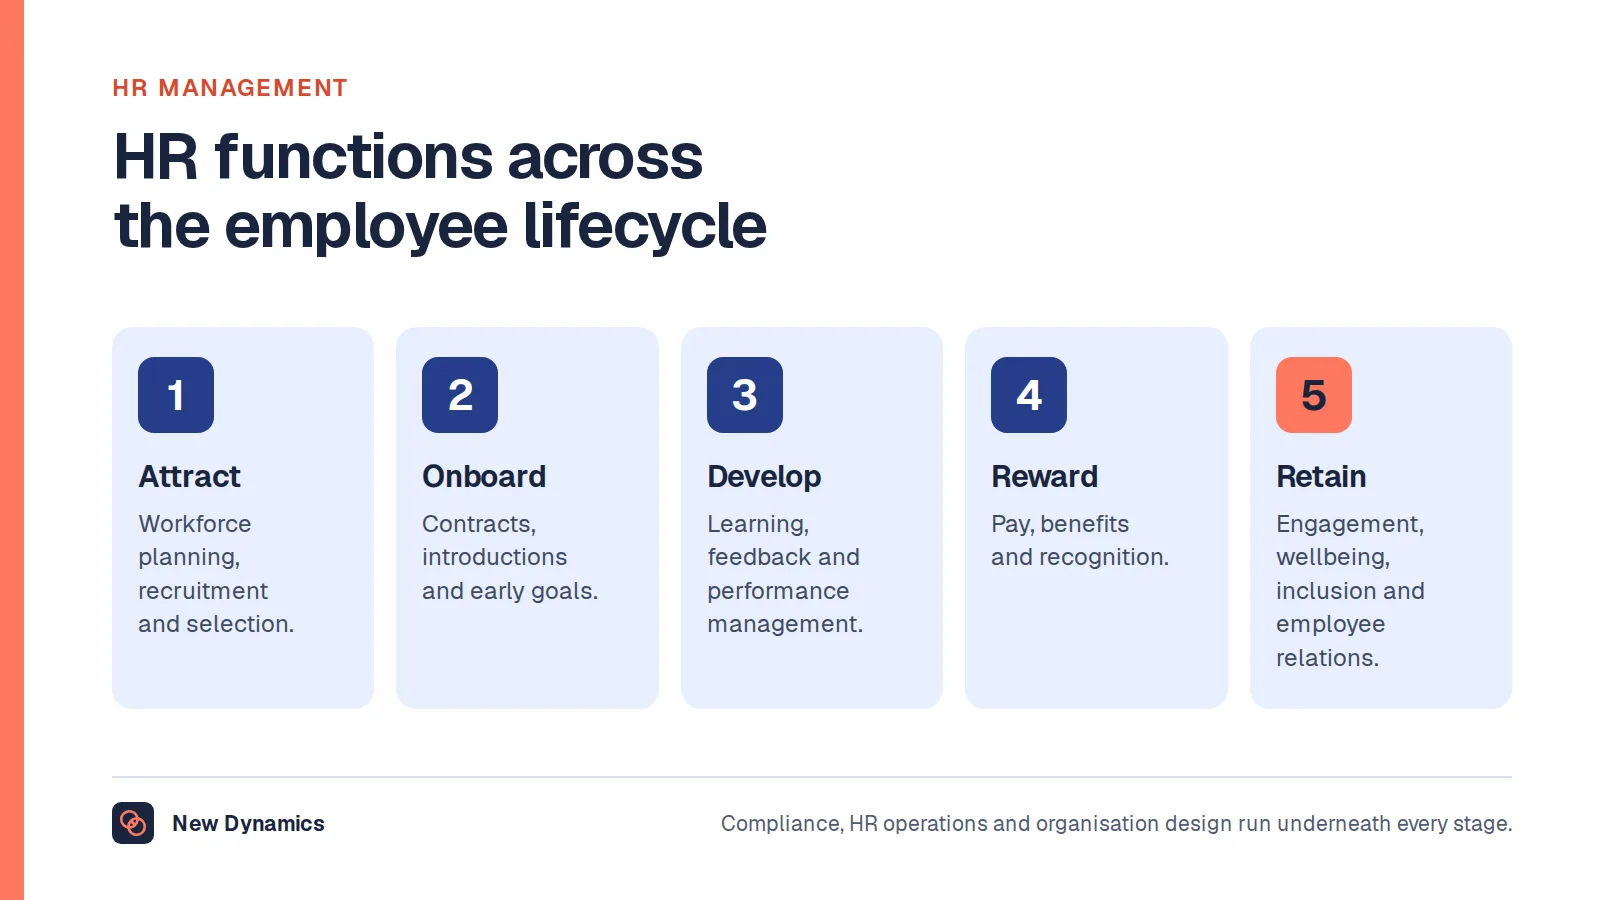
Four or five metrics with published definitions beat twenty without. Our HR management post covers the function these measures describe.
What not to measure
- Anything you would not act on. If no realistic result changes a decision, it is decoration.
- Individual-level engagement scores, which break confidentiality in small teams and teach people to manage the survey.
- Activity for its own sake (training hours delivered, emails sent, tickets closed) which rewards volume over effect.
- Benchmarks you cannot reconstruct. If you cannot see the other organisation's definition, the comparison is guesswork with a decimal point.
This is general information rather than legal advice; the reporting duties described apply as the sources state.
Frequently asked questions
What are HR metrics?
Measures of how an organisation's people processes are working: movement, absence, hiring, progression and whether the basics of performance management happened. Very few have an agreed external definition, so each one carries decisions about who counts, over what period and against what denominator.
Why can't HR metrics be compared between organisations?
Because the definitions differ. Turnover alone hides at least three choices, and no standards body publishes a common method. Two organisations can report the same figure while measuring materially different things.
Which HR metrics have an official definition?
In the UK, the gender pay gap and the CEO pay ratio. Gender pay gap reporting specifies the snapshot date, the 250-employee threshold, the headcount rule and six required calculations. The pay ratio regulations specify the percentiles and require the method to be published alongside them.
What HR metrics should a small organisation track?
Movement, including who you wanted to keep; absence days and pattern; time to hire with a stated start point; internal moves; and whether objectives, one-to-ones and reviews actually happened. Publish the formula for each.
What is the difference between a metric and a KPI?
A metric is any measure; a key performance indicator is one you have decided to manage against, with a target and an owner. Most HR dashboards contain many metrics and few indicators, which is why they get read and not used.
How many HR metrics should a dashboard have?
Few enough that each has a written definition, an owner and a decision attached. Four or five with published formulas are more useful than twenty without, because the second set cannot be defended when questioned.
Should HR measure engagement?
As context, yes. As the main measure, no. An engagement score describes a response; it moves for reasons outside an employer's control, and treating it as a target teaches people to manage the survey rather than the conditions behind it.
Your next step: write the formulas down
- List the metrics you currently report.
- For each, write who counts, over what period and against which denominator.
- Delete any that nobody would act on whatever the result.
- Put the formula next to the number on the next report.
For keeping judgements consistent across managers before they become numbers, read and download our performance calibration guide. The guide is free to read, and the PDF uses our short download form.
Want measures attached to objectives rather than sitting in a slide? Book a New Dynamics demo and bring your current HR report. You can also email contact@new-dynamics.com.