TL;DR
- In the ONS Opinions and Lifestyle Survey edition covering 1 July to 27 September 2026, 26% of adults both worked from home and travelled to work in the past seven days, 40% travelled to work without working from home, and 13% worked from home without travelling to work.
- Hybrid working is concentrated, not universal. The ONS reported that workers with a degree were 10 times more likely to hybrid work than those with no qualifications (41%, compared with 4%), and that 45% of workers earning £50,000 or more hybrid worked against 8% of those earning under £20,000, between January and March 2025.
- There is no official statistic for employer office mandates and none for the four day week. The flexible working right is published fact: a day one right, two statutory applications in any 12 month period, and a decision inside two months.
Search for hybrid working statistics and most of what comes back is a supplier survey of its own customer list. The United Kingdom does have official data on where people work, it is published quarterly, and it is far less dramatic than the headlines built on top of it.
This article sets out the figures that can be checked, the exact periods they cover, the parts of the debate that nobody measures officially, and what an employer should count for itself.
Hybrid teams tend to be reviewed by more than one person, because the manager who sets the work is not always the manager who sees it. See how New Dynamics multi-manager reviews gather evidence from every manager involved.
For the arrangements themselves rather than the numbers, our post on flexible working arrangements covers the types and the process.
Where people in Great Britain actually work
The live official source is the Office for National Statistics Opinions and Lifestyle Survey (OPN). It asks working adults where they worked in the past seven days, which captures regular and irregular patterns alike.
The dataset is Public opinions and social trends, Great Britain: working arrangements by personal characteristics, published on 16 October 2026. The ONS describes it as "Working arrangements of people in Great Britain by personal characteristics; indicators from the Opinions and Lifestyle Survey (OPN)." The current edition covers 1 July to 27 September 2026.

Its location of work table, for all persons, reads as follows.
| Working arrangement, past seven days | Estimate |
|---|---|
| Both worked from home and travelled to work | 26% |
| Didn't work from home and travelled to work | 40% |
| Worked from home and didn't travel to work | 13% |
| Didn't work from home and didn't travel to work | 21% |
Two details decide whether you are reading it correctly.
First, the base is adults who said they were working, and it includes the 21% who neither worked from home nor travelled to work in that particular week. Holiday, sickness and leave all land in that category, so the hybrid and office shares are shares of everyone working, not of everyone who worked that week.
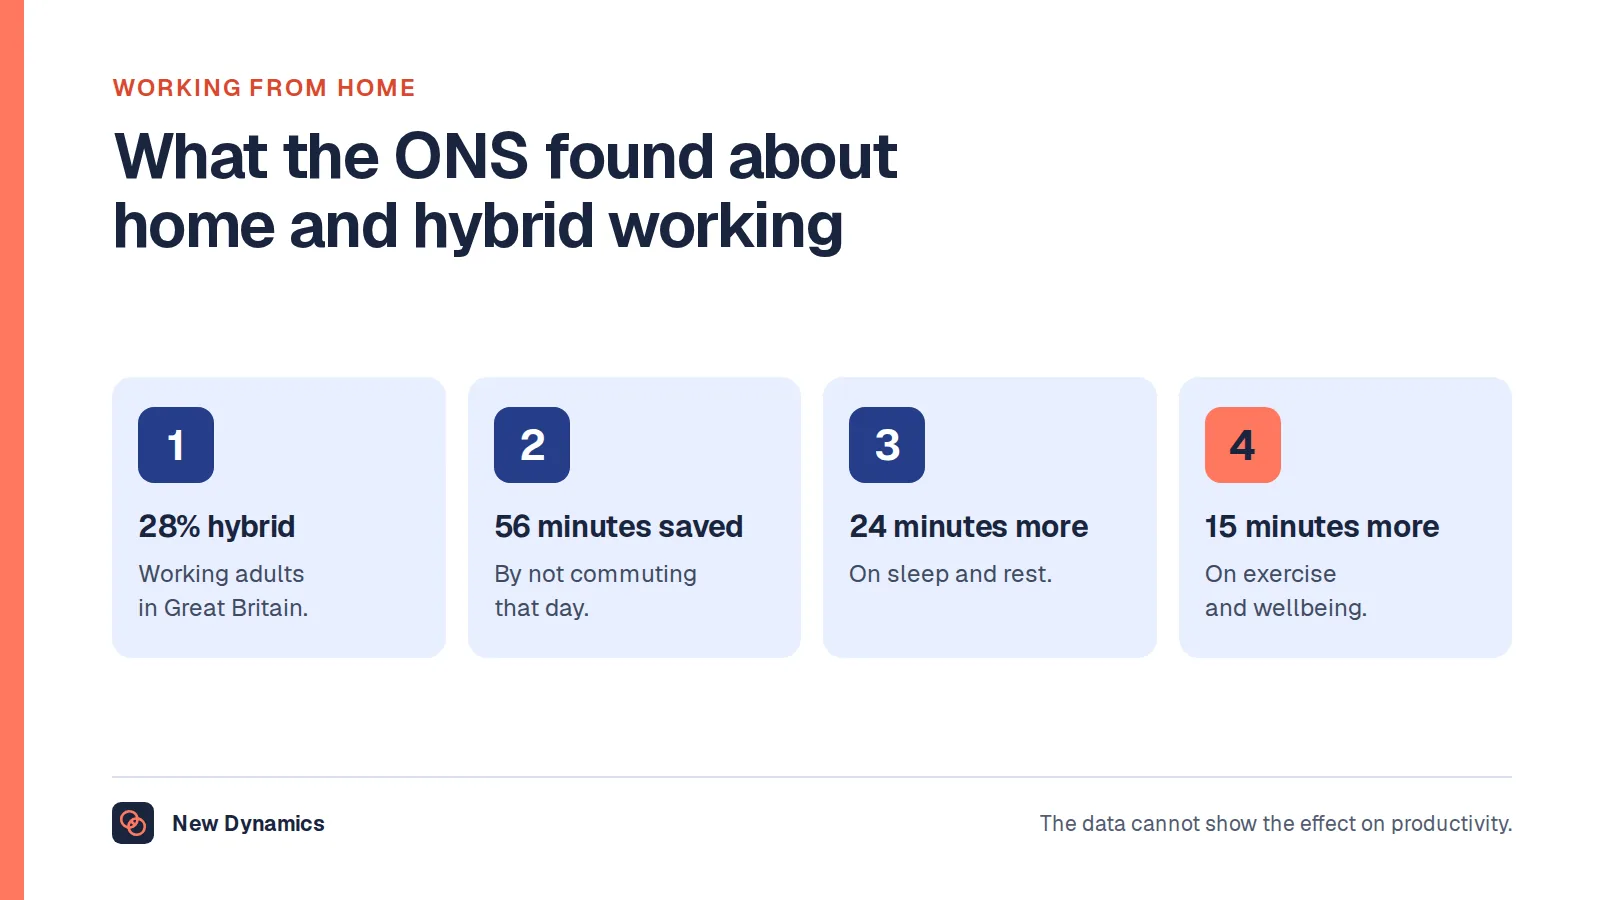
Second, the companion question is about homeworking rather than location. On that question, 12% answered "Yes, all of the time", 28% answered "Yes, some of the time", 35% answered "No, I am not able to work from home" and 8% answered "No, I have not worked from home although I am able to". The ONS also publishes the combined row, "Yes, all of the time or some of the time", at 39%.
The dataset gives a lower and upper 95% confidence interval for every estimate, and its notes explain that where the intervals around two figures overlap, the difference between them should not be treated as real. The hybrid figure of 26% carries an interval of 25% to 28%.
The trend is flatter than the commentary
Because the same two questions are asked every quarter, the editions can be lined up. Taking the location of work table for all persons:
| Edition reference period | Hybrid | Travelled in only | Home only | Neither |
|---|---|---|---|---|
| 8 January to 30 March 2025 | 28% | 41% | 14% | 17% |
| 7 January to 29 March 2026 | 27% | 41% | 13% | 19% |
| 1 July to 27 September 2026 | 26% | 40% | 13% | 21% |
Read that carefully before quoting it. The hybrid share has drifted down by two percentage points across roughly eighteen months, the confidence intervals overlap, and the share who worked in neither place rose by four points over the same span, which pulls every other row down a little. The honest summary is that the pattern has been broadly stable, not that hybrid working is collapsing.
The ONS reached the same conclusion in its article Who has access to hybrid work in Great Britain?, published on 11 June 2025, which reported that "More than a quarter (28%) of working adults in Great Britain hybrid worked between January and March 2025; the proportion of hybrid workers has gradually risen since March 2022, but those who only travel to work has declined." It added that "The trend in those working solely from home has remained broadly constant."
Who actually gets to work this way
Hybrid working is not evenly available, and the June 2025 article is unusually blunt about it. Every figure below covers January to March 2025 and comes from that release.
- Qualifications. Workers with a degree or equivalent were "10 times more likely to hybrid work than those with no qualifications (41%, compared with 4%, respectively)".
- Income. "Almost half (45%) of workers with an income of £50,000 or more hybrid worked, compared with only 8% of those with an income of under £20,000."
- Hours. "Hybrid work was more common among full-time workers (34%) than adults in part-time jobs (18%)."
- Age. "Around a third (36%) of those aged 30 to 49 years were hybrid workers between January and March 2025. This compared with 19% for younger workers (aged 16 to 29 years) and 24% for older workers (aged 50 to 69 years)."
- Disability. "Disabled workers (24%) were less likely than non-disabled workers (29%) to hybrid work."
- Status. "Employees (30%) were more likely to hybrid work than self-employed workers (24%)."
- Deprivation. "Almost a third (32%) of workers in the least deprived Index of Multiple Deprivation (IMD) quintile were hybrid workers, compared with 24% in the most deprived IMD quintile."

The sample behind it is stated plainly in the release: "Between 8 January to 30 March 2025, we sampled 28,049 households", the responding sample was 11,894 individuals, and the analysis rests on "the 5,494 adults who said they worked in a paid job as an employee or self-employed".
The practical point for an employer is that a policy written as though hybrid working is the norm describes about a quarter of the workforce, and a policy that treats it as a perk for senior people will simply reproduce the pattern the ONS has already measured.
Return to office: the statistic that does not exist
There is no official United Kingdom statistic for how many employers require staff on site, or for how many days they require. The closest official measures are both indirect.
The first is the worker side, from the same OPN table. Travelling to and from work, exclusively or in combination with working from home, was 66% in the edition covering 1 July to 27 September 2026, against 69% in each of the two January to March editions above. That is movement of three percentage points, and it is the best official proxy available.
The second is the business side, and it has gone quiet. The ONS Business Insights and Conditions Survey (BICS) once carried homeworking questions. The bulletin Business insights and impact on the UK economy: 22 October 2026 reports wave 166, live from 5 to 18 October 2026, and lists what businesses were asked about: turnover, prices of goods and services, energy and fuel prices, global supply chain disruption, worker shortages and recruitment difficulties, business concerns, and business performance. Homeworking is not on the list. The ONS warns in the same bulletin that BICS "questions and topics are regularly reviewed, and questions are often added, removed, or amended to reflect changing circumstances and analytical priorities".
So when you see a confident figure for the share of United Kingdom employers mandating three days in the office, it did not come from an official source, because no official source counts it.
Why people work from home, in their own words
The ONS published a user requested dataset, "Public opinions and social trends, Great Britain: reasons for working from home in the past seven days", on 3 October 2025, covering 3 to 28 September 2025. It asked the 570 respondents who had worked from home why they did so, and respondents could choose more than one answer.
| Reason given | Estimate |
|---|---|
| I preferred working from home | 47% |
| My job or employer required me to work from home | 30% |
| I needed flexibility for personal reasons | 22% |
| To save on travel costs | 17% |
| I had care giving responsibilities | 5% |
| Due to a long-term health condition or illness | 4% |
Preference is the largest single reason and employer requirement is second. That matters for anyone drafting an attendance policy, because roughly half of homeworking in that period was a choice being made rather than an instruction being followed, and choices are what a policy change actually takes away.
Flexible working requests: published law, not a published statistic
No official body publishes how many statutory flexible working requests are made or refused each year. What is published is the rule, and it is worth getting right.
This section is general information about the position in England, Wales and Scotland rather than legal advice. GOV.UK notes that "Flexible working rules are different in Northern Ireland."

GOV.UK guidance on applying for flexible working states that "Employees can apply for flexible working from their first day in a job", that the employer "makes a decision on it within 2 months - or longer if agreed with the employee", that "Employees can make 2 applications for flexible working in any 12-month period", and that "The employer must discuss the employee's request with them before refusing their application".
The permitted grounds for refusal are listed, and there are eight of them: extra costs that will damage the business, the work cannot be reorganised among other staff, people cannot be recruited to do the work, flexible working will affect quality, flexible working will affect performance, the business will not be able to meet customer demand, there is a lack of work to do during the proposed working times, and the business is planning changes to the workforce.
Acas guidance on the right to request, last updated on 14 January 2026, puts the employer duties in one place. By law, under the Employment Rights Act 1996, "anyone with the legal status of employee has the statutory (legal) right to request flexible working", and "The right applies from the first day of employment." An employer receiving a statutory request must "accept the request unless there's a genuine business reason not to", must consult the employee before deciding unless the request is accepted in full, must handle the request reasonably in line with the Acas Code of Practice, and must "make a final decision, including any appeal, within a maximum of 2 months".
If you want a number here, it has to be your own: requests received, requests accepted in full, requests accepted in part, requests refused, and the reason given in each refusal.
The four day week: expect no official statistic
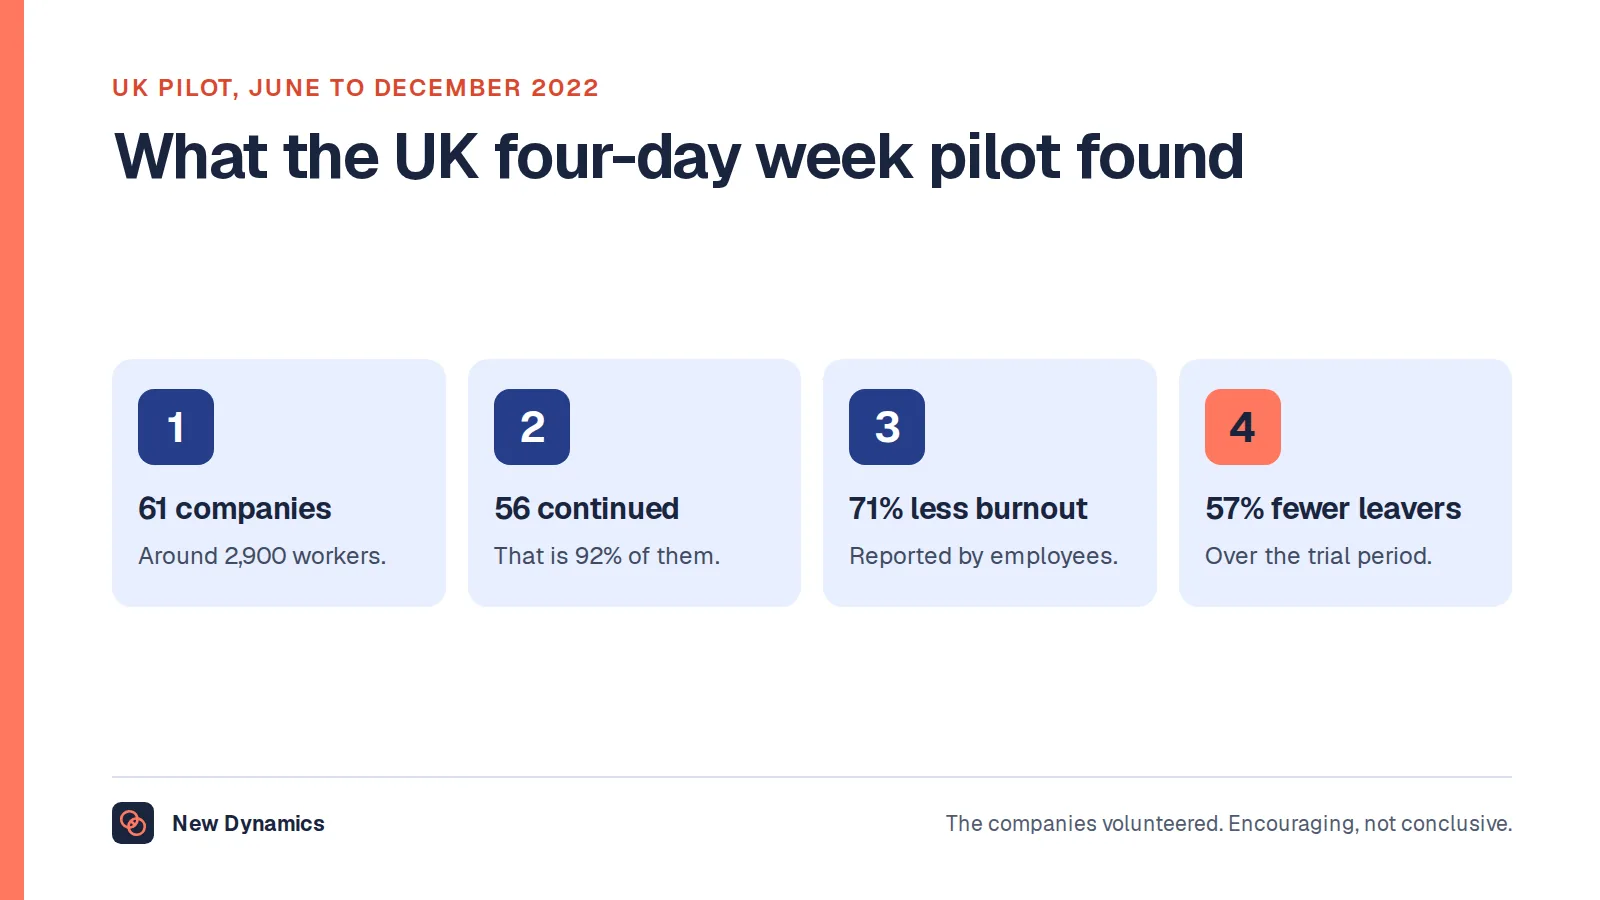
There is no official United Kingdom statistic on the four day week. The ONS does not publish one, and neither does any other official body. Any percentage you see for adoption, productivity or retention under a four day week comes from somewhere else.
What does exist is a set of trial results published by the organisations that ran the trials. Those are not official statistics. Participation was self-selected, which means the employers taking part were the ones who already believed it could work for them, and the reported outcomes are their own. Read them as case material, not as a national measure, and treat any single headline percentage from them with the same caution you would apply to a supplier case study.
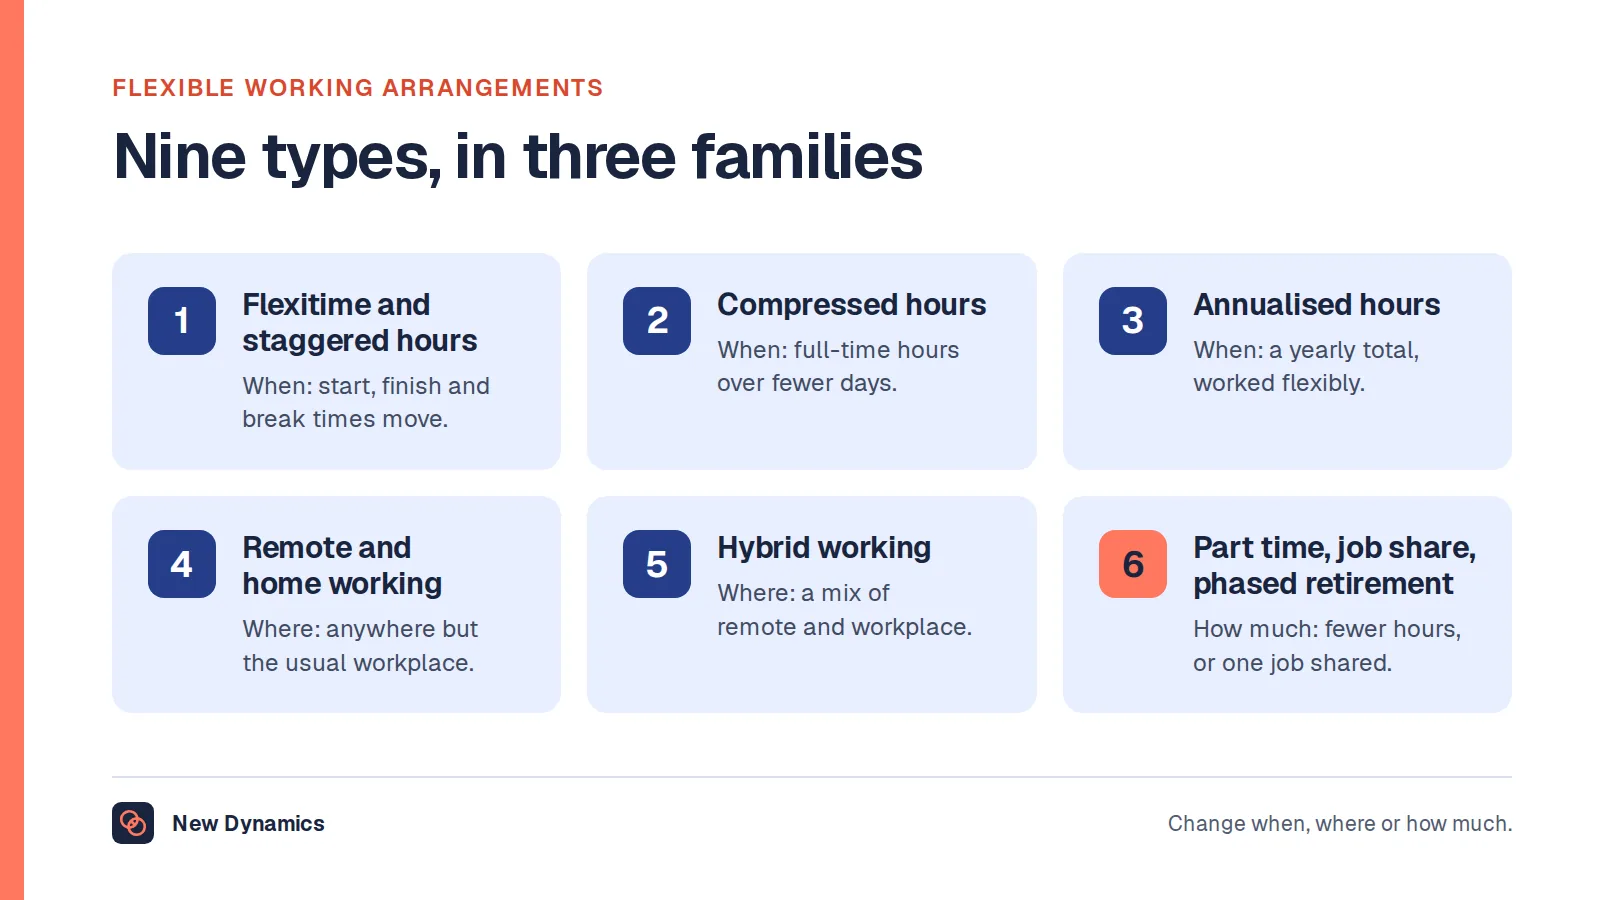
The official hook is narrower and more useful. Acas lists compressed hours among the types of flexible working, alongside part-time hours, staggered hours, remote working, working from home, hybrid working, flexitime and job sharing. A four day week delivered as compressed hours is therefore a change that can go through the statutory request route described above, with the same deadlines and the same grounds for refusal. Our post on four day week benefits covers the arguments in more detail.
If you run your own trial, decide the measures before it starts: output per week on a definition you already use, service levels and response times, absence, voluntary leavers, overtime and agency spend, and a short repeated question to staff that you ask in the same words every time. Set the comparison period before you begin, and keep a control group if the organisation is large enough to allow one.
What to measure in your own organisation
National figures tell you what is normal. They do not tell you whether your own arrangement is working. Four of these come straight out of your existing systems.
- Attendance against the agreement. Not days in the building for their own sake, but how often the pattern people agreed is the pattern that happens.
- Who has access. Split hybrid eligibility by job family, pay band, working pattern and length of service. The ONS has already shown how uneven access is nationally, and your own split is the version you can change.
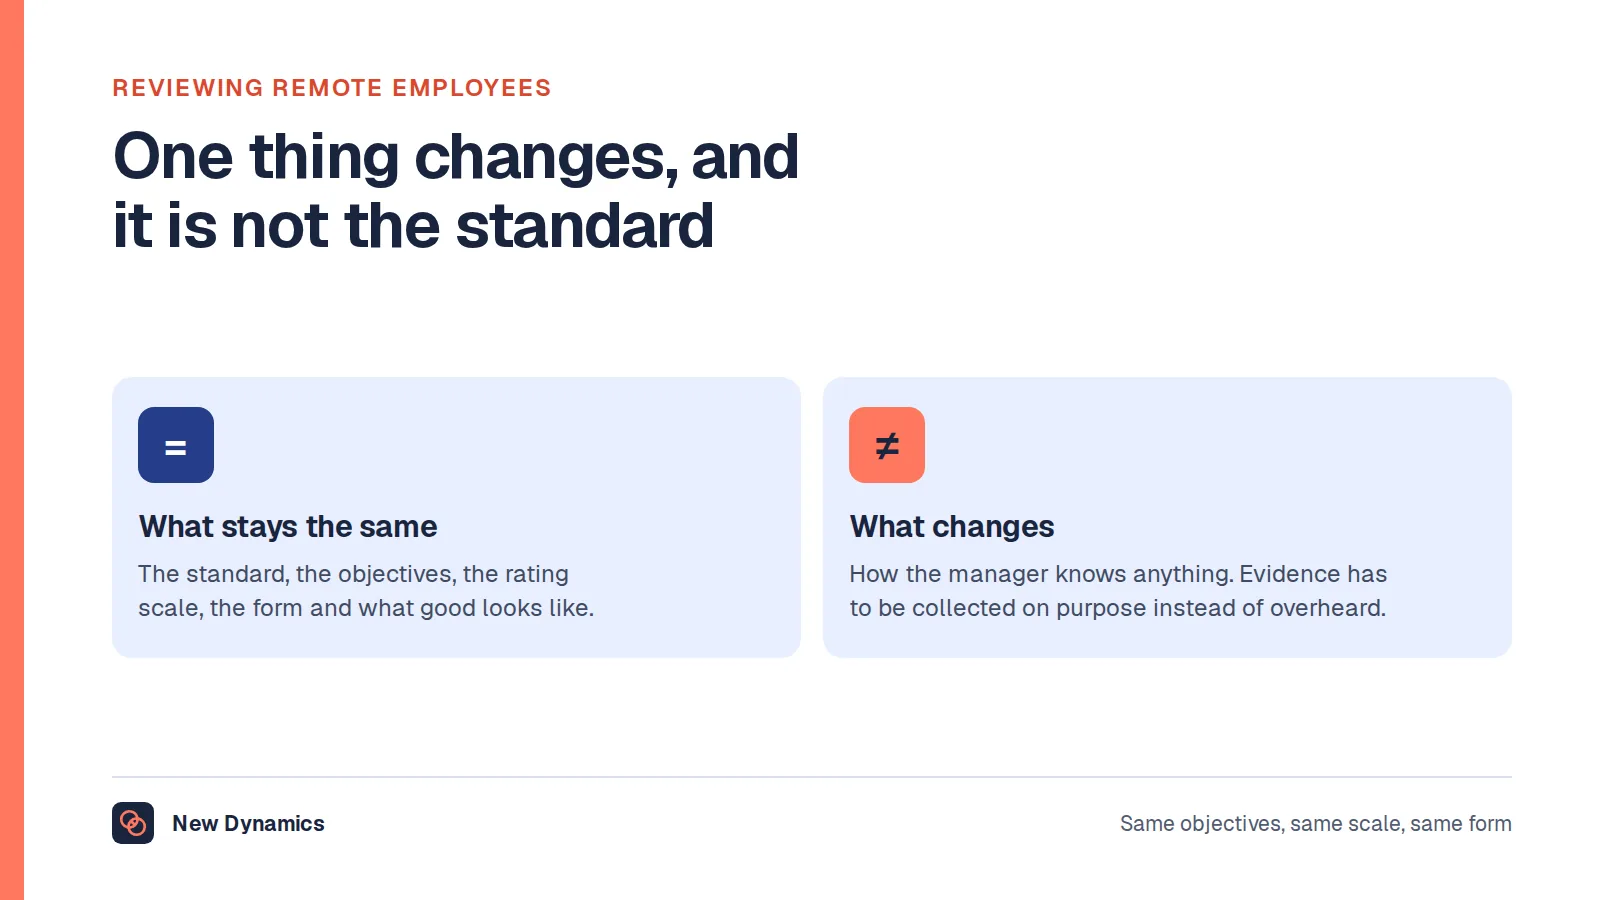
- Review coverage and quality by working pattern. If people who work mostly at home get fewer completed reviews or thinner evidence, that is a measurable fairness problem rather than a feeling. Our post on the remote performance review sets out how to keep the evidence even.
- Flexible working requests, with outcomes. Volume, acceptance in full, acceptance in part, refusal, and the ground relied on.
- Progression and pay by working pattern. The hardest number to produce and the most important one, because it is where a hybrid policy either is or is not fair.
For the wider set of published United Kingdom figures on work, pay and the workforce, our HR statistics hub collects them with the publisher and the period attached.
What usually goes wrong
- Quoting a supplier survey as a national figure, which is the single most common error in this topic.
- Dropping the reference period, so a figure from early 2025 is presented as current.
- Ignoring the base. The ONS hybrid share is a share of all working adults, including those who did not work that week.
- Reading a one or two point move as a trend when the confidence intervals overlap.
- Treating an office mandate statistic as official when no official source counts it.
- Writing an attendance policy without checking who in your own organisation has access to hybrid working in the first place.
Frequently asked questions
What percentage of UK workers are hybrid working?
In the ONS Opinions and Lifestyle Survey edition covering 1 July to 27 September 2026, 26% of working adults in Great Britain both worked from home and travelled to work in the past seven days, with a confidence interval of 25% to 28%. The ONS reported 28% for the period January to March 2025.
How many people work fully remotely in the UK?
For 1 July to 27 September 2026, 13% of working adults worked from home and did not travel to work in the past seven days. On the separate homeworking question, 12% said they worked from home all of the time. Both figures cover Great Britain rather than the whole United Kingdom.
Are there official return to office statistics for the UK?
No. No official body counts employer office mandates. The nearest official measure is the ONS share travelling to and from work, exclusively or in combination with working from home, which was 66% for 1 July to 27 September 2026 against 69% in the January to March editions of the two preceding years.
How many flexible working requests can an employee make?
GOV.UK states that employees can make 2 applications for flexible working in any 12-month period, that the right applies from the first day in a job, and that the employer must decide within 2 months unless a longer period is agreed. This is general information rather than legal advice, and the rules differ in Northern Ireland.
Are there four day week statistics for the UK?
No official statistic exists. The figures in circulation come from trials published by their organisers, with self-selected participants, so they describe those employers rather than the economy. Measure your own trial against your own baseline instead.
Which workers are most likely to work hybrid?
Between January and March 2025 the ONS found hybrid working highest among graduates (41%, against 4% of those with no qualifications), higher earners (45% of those on £50,000 or more, against 8% of those under £20,000), full-time workers (34% against 18% part-time) and those aged 30 to 49 (36%).
Your next step: replace the borrowed figure with your own
- Write down which of your roles can be done from home at all, and which cannot. That is the honest denominator for every hybrid number you will report.
- Pull your flexible working requests for the last twelve months and record the outcome and the ground relied on for each one.
- Split review completion and evidence quality by working pattern, and look at the gap before anyone argues about it.
- Pick one measure of output you already trust, and set the baseline before you change any attendance rule.
For the practices behind the figures, read and download our remote work guide. The guide is free to read, and the PDF uses our short download form. Our post on the benefits of working from home covers the case employees usually make.
Want reviews that work the same whether someone is at a desk or at a kitchen table? Book a New Dynamics demo and bring your current attendance policy. You can also email contact@new-dynamics.com.