TL;DR
- Annual growth in average regular earnings excluding bonuses was 3.7% in June to August 2026, and total earnings including bonuses also grew 3.7%, down from 3.9% on the previous three-month period. After inflation the same regular pay growth is 0.6% against CPIH and 0.8% against CPI, so the index you quote changes the answer.
- Median gross weekly earnings for full-time employees were £811.20 in April 2026, up 5.8% on the year. Median monthly pay across the highlighted industry sectors ranged from £1,444 in accommodation and food service activities to £4,332 in finance and insurance in September 2026.
- No official statistic counts how many employers publish salary ranges. What is real is the UK duty on employers with 250 or more employees to report their gender pay gap, and the EU pay transparency directive, which applies in EU member states and not in the UK.
Three different official figures all answer to the name "average pay". They come from the same statistics office, often in the same week, and they say different things. One is a growth rate for average earnings. One is the median earnings of a full-time employee. One is the median monthly pay of everybody on a payroll.
This article sets out which is which, what each one covers, the sector breakdown that people usually mean when they ask about median salary by sector, and what the law actually requires anyone to publish about pay.
Pay decisions and review decisions end up in the same conversation, and the evidence for both needs to sit in one place. See how New Dynamics performance reviews keep the year's evidence attached to the cycle that sets the rating.
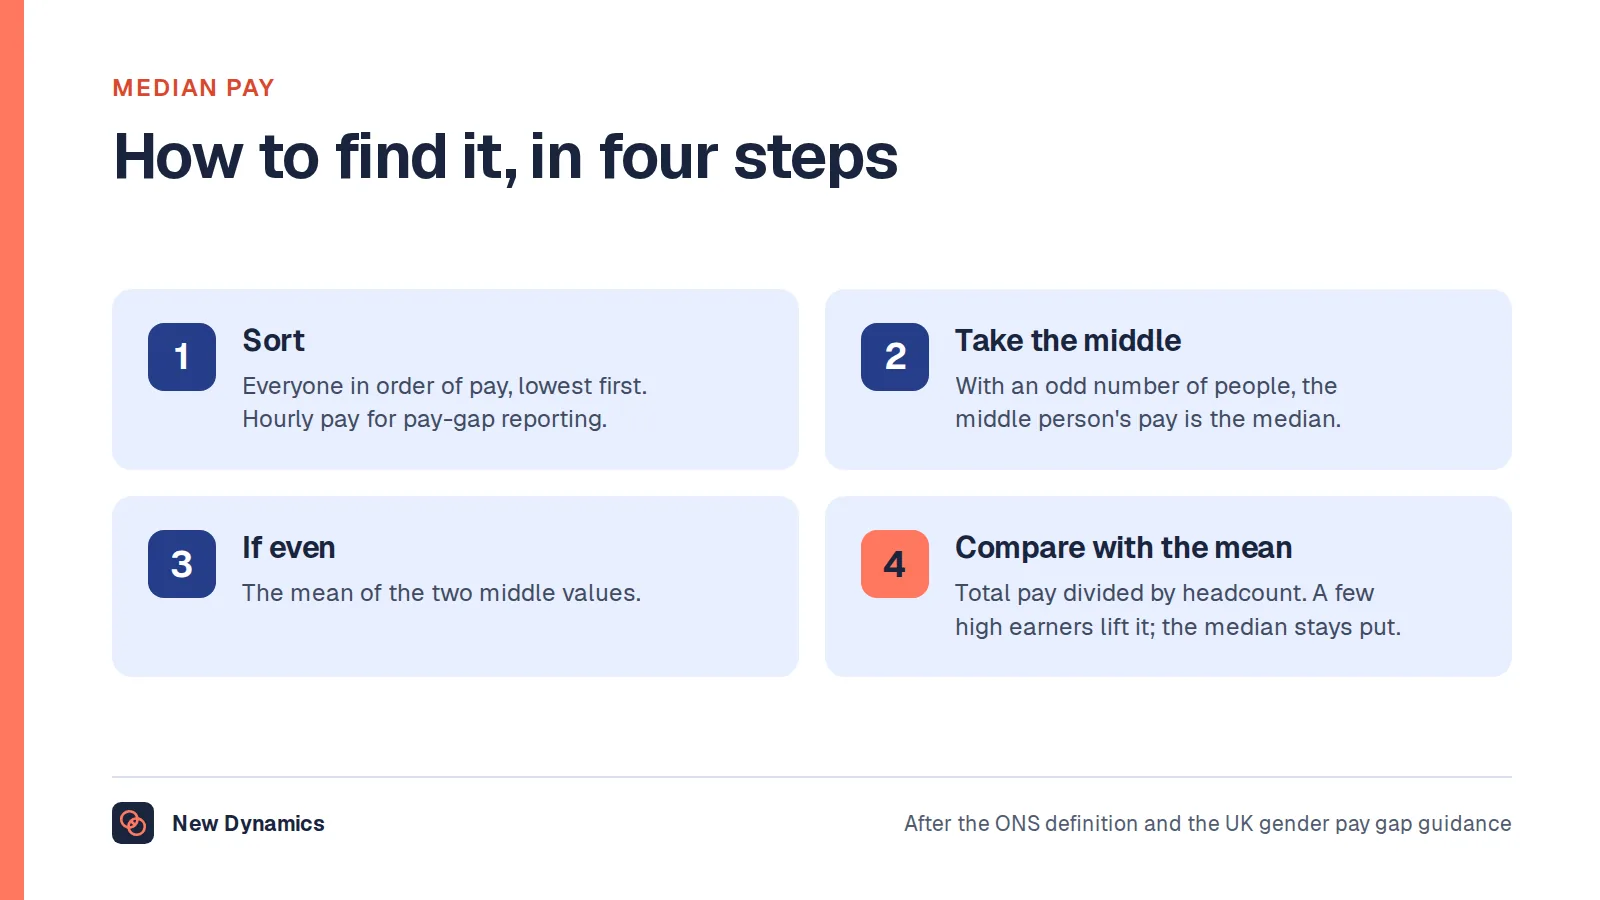
For the measure itself, our post on median pay explains why the middle is usually the more honest average.
The average pay rise in the UK
The nearest thing to a national pay rise is the Office for National Statistics earnings growth series. The Average weekly earnings in Great Britain bulletin released on 20 October 2026 reports that "Annual growth in employees' average regular earnings (excluding bonuses) was 3.7% in June to August 2026", and that "Annual growth in total earnings (including bonuses) was 3.7% in June to August 2026, down from 3.9% on the previous three-month period."
Two things are easy to get wrong when quoting that.
Regular pay excludes bonuses. Total pay includes them. The two figures happened to land at the same 3.7% in this period, which is a coincidence of timing rather than a rule. When bonus seasons move between quarters, total pay growth jumps around while regular pay growth stays steadier. Say which one you mean.
It is an average of earnings, not a settlement. The series measures what employers actually paid per week, so it moves with overtime, hours, starters, leavers and the mix of jobs in the economy, not only with the rise handed out at a pay review. The whole economy level in the same period was £757 a week for total pay and £707 for regular pay.

The geography matters too. This series covers Great Britain, while the survey figures later in this article cover the United Kingdom. The difference is small, and quoting the wrong one is still a mistake worth avoiding.
Real pay depends on which inflation index you pick
A pay rise below inflation is a pay cut, so the real-terms figure is the one most people actually want. The same October 2026 bulletin publishes it twice, against two different measures of inflation.
Against the Consumer Prices Index including owner occupiers' housing costs, it reports that "Annual growth in real terms, adjusted for inflation using the Consumer Prices Index including owner occupiers' housing costs (CPIH), was 0.6% for regular pay and 0.7% for total pay in June to August 2026."
Against the narrower index, "When using the Consumer Prices Index excluding owner occupiers' housing costs (CPI), annual growth in real terms for regular pay was 0.8%, and for total pay it was 0.9%, in June to August 2026."
Same pay, same period, two answers. CPIH includes the costs of owner occupied housing and CPI does not, so CPIH was running higher and leaves less real growth. There is no trick here, but there is a reporting habit worth breaking: quoting "real pay growth" with no index named is quoting a number that has two values.
The median full-time salary, and the two versions of it
Growth rates do not tell anyone what a job pays. For levels, the source is the Annual Survey of Hours and Earnings, published as Employee earnings in the UK. The release of 22 October 2026 covers April 2026 and reports that median weekly earnings for full-time employees were £811.20 in April 2026, compared with £766.60 in April 2025, a nominal increase of 5.8% and an increase of 2.7% in real terms.
The annual figure is reported on a narrower base. The same bulletin states that "median gross annual earnings for full-time employees who had been in their job for at least a year were £40,911 in April 2026, compared with £39,157 in April 2025, a 4.5% increase".
That qualifier does real work. The weekly figure covers full-time employees generally. The annual figure covers only those who had been in the same job for at least a year, because an annual total is meaningless for somebody who started in November. The two are not the same population, which is why their growth rates differ, 5.8% weekly against 4.5% annual. Multiplying the weekly median by 52 does not reproduce the annual median either, and nobody should try.
A median is also not a mean. Half of full-time employees earned more than £811.20 a week and half earned less. High earners pull a mean upwards and leave it describing nobody.
Median salary in the UK by sector
Two official breakdowns answer this, and they are not interchangeable.
The survey splits the economy by ownership. In April 2026, median gross weekly earnings for full-time employees were £862.20 in the public sector, a 6.5% increase on the year, and £794.40 in the private sector, a 5.5% increase on the year.
For industry sectors, the more current source is the payroll data the ONS draws from HM Revenue and Customs records. The Pay As You Earn Real Time Information bulletin released on 20 October 2026 reports that "Early estimates for September 2026 indicate that median monthly pay was £2,660, an increase of 4.4%, compared with the same period of the previous year." On the sector split it reports that "Median pay in September 2026 across the highlighted sectors ranged from £1,444 in the accommodation and food service activities sector, to £4,332 in finance and insurance."

That is a spread of roughly three to one between the lowest and highest paid sectors highlighted. Read it with one caution attached: payroll median pay covers everybody paid through PAYE, full-time and part-time together. Accommodation and food service has a large part-time workforce, so part of that gap is hours rather than hourly rates. The survey figures quoted above are the ones restricted to full-time employees.
Pay growth by sector and occupation
Growth also varies by sector, and the two sources agree on the broad shape.
On earnings growth, the October 2026 bulletin reports that annual average regular earnings growth "remained at 6.3% for the public sector" while growth "increased slightly to 3.0% for the private sector", and that "After the public sector, the finance and business services sector showed the strongest regular earnings annual growth rate at 3.3%." Manufacturing was at 2.9%, wholesaling, retailing, hotels and restaurants at 2.7%, and construction the slowest at 1.1%.
On the survey side, the April 2026 release states that "Median gross weekly earnings for full-time employees increased across all industries between 2025 and 2026", with the fastest growth in "water supply; sewerage, waste management and remediation activities (10.4%)" and "mining and quarrying (8.5%)", followed by human health and social work at 7.3%.
By occupation group, growth was "particularly strong for managers, directors and senior officials (6.7%)", with caring, leisure and other service occupations at 5.4%, elementary occupations at 4.7% and process, plant and machine operatives at 4.1%.
Two readings follow. Fast growth in a sector does not mean high pay in that sector, and the reverse holds as well. And a sector average still contains every job in that sector, so it is a weak guide to what one role should pay.
Pay transparency statistics: what is published, and what is law
Search for pay transparency statistics and you will find percentages of employers said to publish salary ranges. No official United Kingdom statistic measures that. The figures in circulation come from vendor and membership surveys of self-selecting respondents, and they describe the panel rather than the economy. This is the honest answer, and it is worth giving before reaching for a number.
What does exist is a set of legal duties, and they belong to different jurisdictions.

The United Kingdom gender pay gap reporting duty. The gov.uk guidance states that "Any employer with 250 or more employees on a specific date each year (the 'snapshot date') must report their gender pay gap data" and that "You must report and publish your gender pay gap information within a year of your snapshot date." The guidance on when to report sets the snapshot date at 31 March for most public authority employers and 5 April for private, voluntary and other employers, with reporting deadlines of 30 March and 4 April. This is a duty to publish gap figures, not a duty to publish salary ranges in adverts.
Ethnicity and disability pay gap reporting. The government announced on 25 March 2026 that "Firms with 250 or more employees will be required to publish 6 key pay-gap metrics" and new workforce composition data for ethnicity and disability. The announcement says the government will legislate as soon as possible and gives no commencement date, so this is a commitment rather than a duty in force.
The EU pay transparency directive. The European Commission's equal pay page describes a directive giving "a right to information on pay prior employment, a prohibition to ask salary history and a prohibition of non-disclosure agreements on salaries", and a right for workers "to request information on average pay levels". It states that "EU Member States must transpose the Directive into national law by 7 June 2026".
The United Kingdom is not an EU member state, so that directive does not create duties for a UK employer's UK workforce. It does matter to UK-headquartered groups with employees in EU countries, where the national transposing law applies. This article is general information about published statistics and rules, not legal advice. Take advice on your own obligations.
The gender pay gap figures
The one transparency number the United Kingdom does publish properly is the gap itself. The Gender pay gap in the UK release of 22 October 2026, covering April 2026, reports that "The gender pay gap for full-time employees has continued to decline in the UK. It was 6.8% in April 2026, down from 7.2% in April 2025." Among all employees, including part-time workers, it reports that the gap "decreased to 12.3% in April 2026, down from 13.0% in April 2025".
In money, full-time median hourly earnings excluding overtime were £21.51 for men and £20.05 for women in April 2026.
The gap widens sharply with age. For full-time employees in April 2026 it was 0.3% for those aged 18 to 21, 4.1% at 30 to 39, 8.2% at 40 to 49, 11.0% at 50 to 59 and 11.2% at 60 and over. The long trend is downward: the release notes a fall "from 16.4% in April 2001 (25 years ago), to 9.4% in April 2016 (a decade ago) and 6.8% in April 2026".
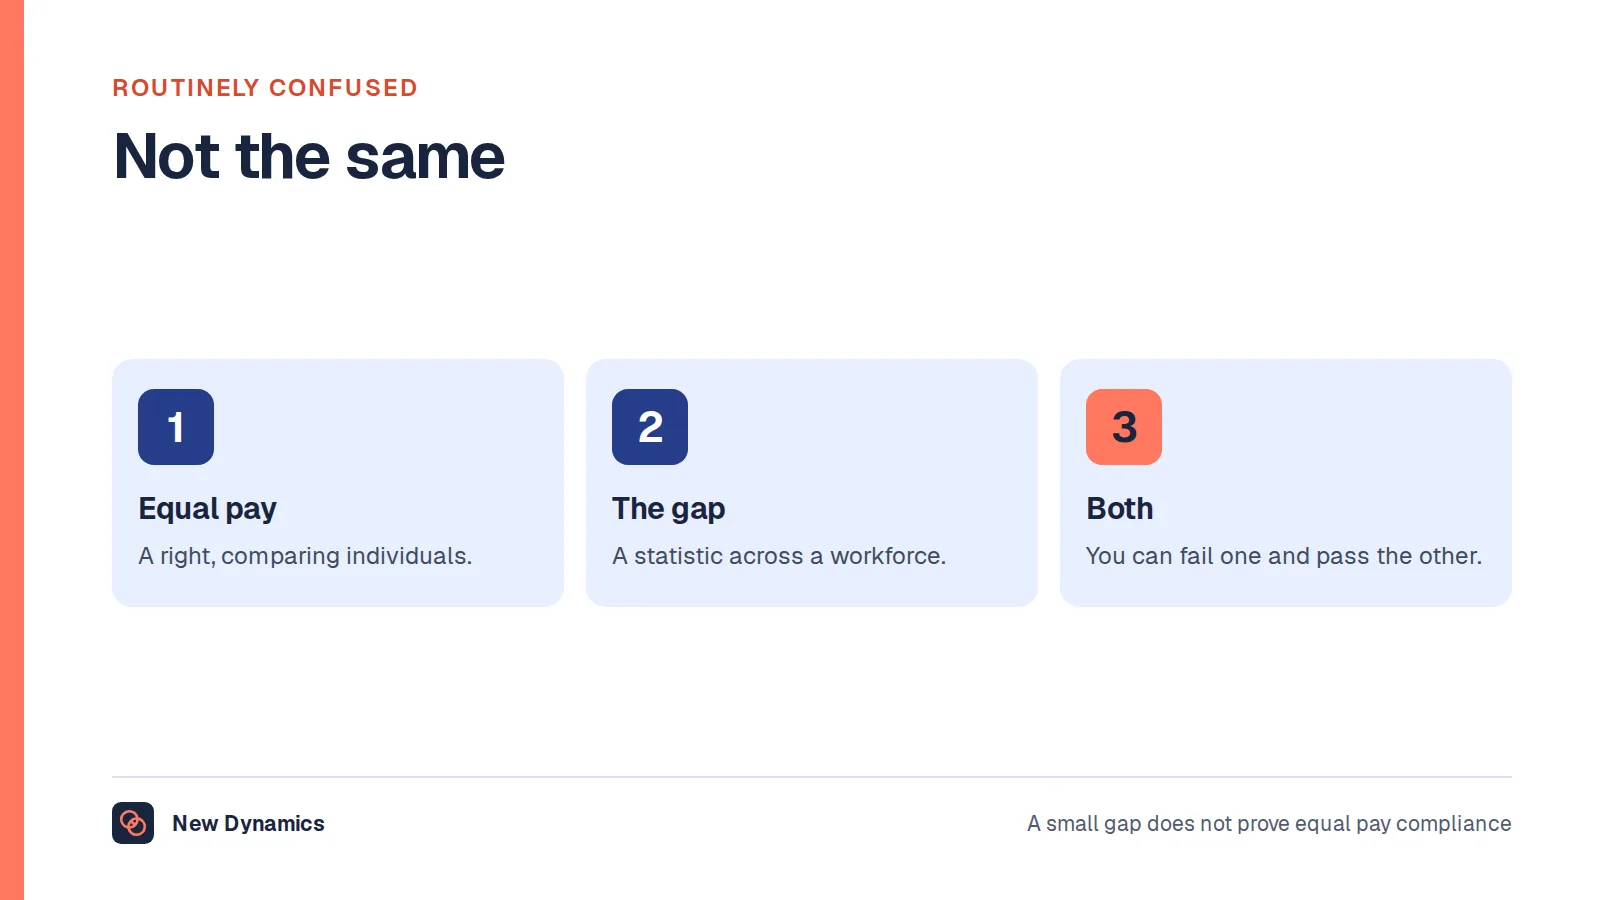
Read that gap for what it is. It compares all men with all women across the whole workforce, so it reflects which jobs people hold as much as what they are paid for the same job. It is not a measure of equal pay for equal work, and our post on pay equity sets out the difference.
What no official statistic will tell you
- How many employers publish salary ranges. Not measured in the United Kingdom by anybody official.
- What your sector will award at the next pay review. Forecasts exist. They are forecasts, not statistics.
- A national ethnicity or disability pay gap for employers. Not yet, because the reporting duty is not in force.
- The market rate for one specific role in one specific place. The published breakdowns stop well above that level of detail.
- Whether your own pay decisions are consistent. That evidence sits inside your organisation, uncounted until you count it.
What to measure in your own organisation
- Your own median, split the way the official figures are split. Full-time and part-time separately, because mixing them produces the larger gap for the wrong reason.
- Your award distribution, not your average award. An average rise of a few per cent can hide a third of people getting nothing.
- Your real-terms position, with the index named. Pick CPIH or CPI, write down which you chose, and keep using it.
- Your pay gaps by group, wherever the numbers are large enough to protect anonymity, and beyond the categories the law names.
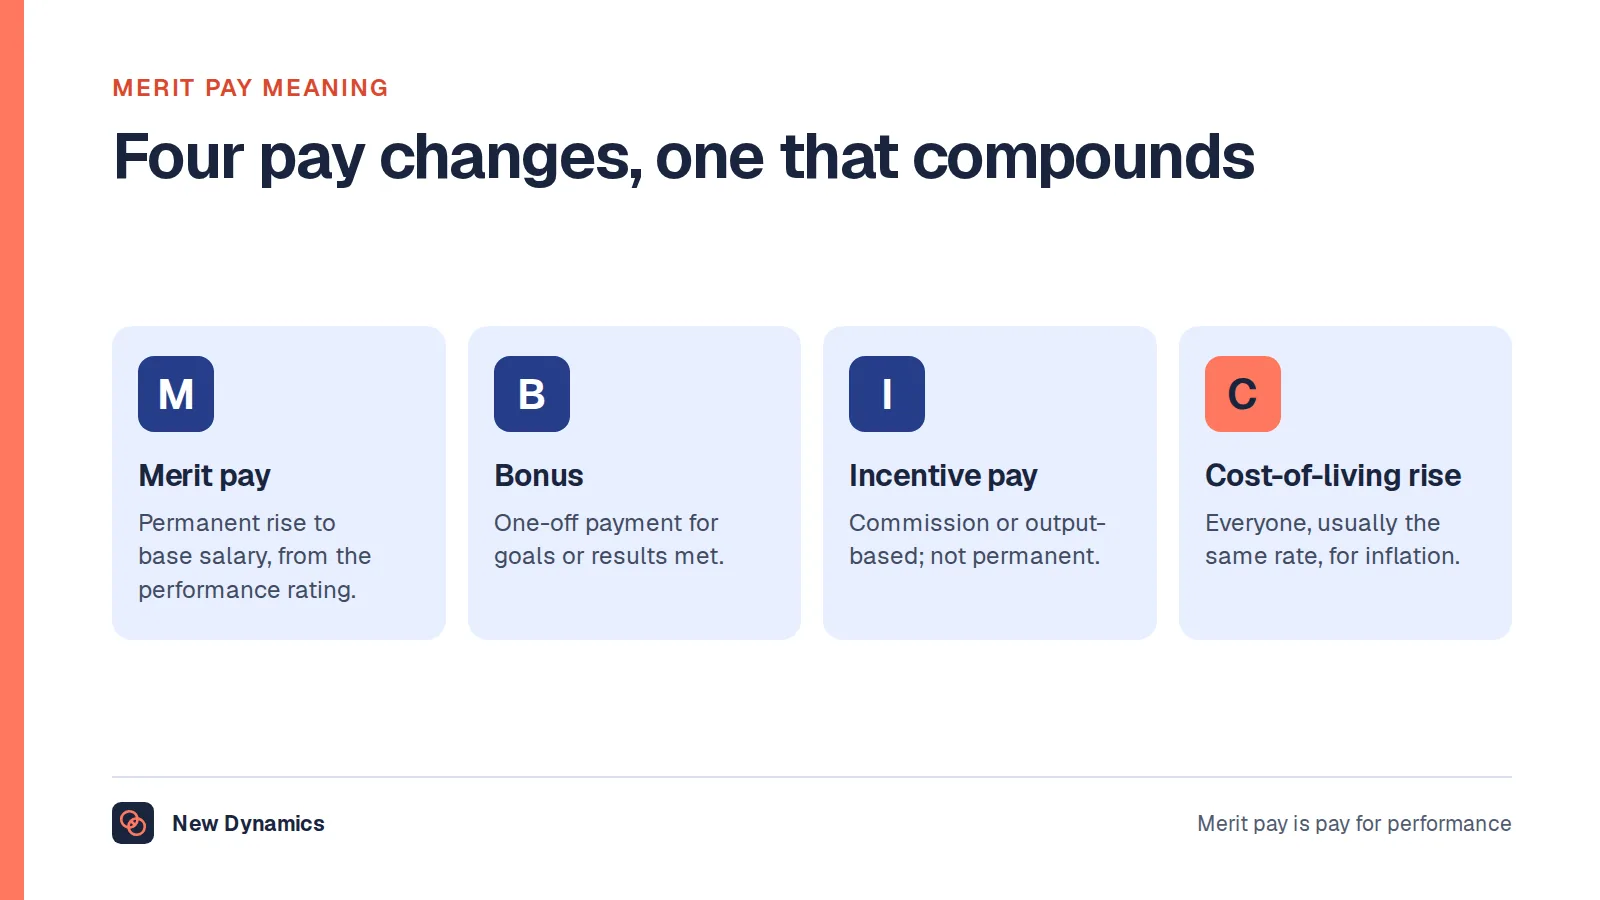
- The link between rating and rise. If ratings drive pay, the distribution of ratings is a pay statistic, and our post on merit pay covers what that linkage does to behaviour.
For the wider set of published United Kingdom figures on work, pay and the workforce, our HR statistics hub collects them with the publisher and the period attached.
What usually goes wrong
- Quoting earnings growth as though it were the pay rise employers awarded. It is an average of what was paid, including hours and job mix.
- Mixing regular and total pay between years, which makes a bonus timing change look like a pay trend.
- Saying "real pay" without naming the index, when the published answer differs by two tenths of a point depending on the choice.
- Multiplying a weekly median by 52, which does not reproduce the published annual median and never will.
- Comparing a full-time survey median with a payroll median covering part-time workers too.
- Treating the gender pay gap as an equal pay measure, which it is not, and which leads to the wrong remedy.
- Importing an EU transparency rule into a UK handbook, or assuming a UK reporting duty covers salary ranges in adverts.
Frequently asked questions
What is the average pay rise in the UK?
The closest official measure is earnings growth. Annual growth in average regular earnings excluding bonuses was 3.7% in June to August 2026, and annual growth in total earnings including bonuses was also 3.7%, down from 3.9% on the previous three-month period. Those figures cover Great Britain and measure what employers paid, not the rise agreed at a pay review.
What is the average pay rise after inflation?
It depends on the inflation measure. For June to August 2026, real growth was 0.6% for regular pay and 0.7% for total pay against CPIH, and 0.8% for regular pay and 0.9% for total pay against CPI. Always name the index, because the same pay produces two published answers.
What is the median salary in the UK?
Median gross weekly earnings for full-time employees were £811.20 in April 2026, up 5.8% on the year. Median gross annual earnings for full-time employees who had been in their job for at least a year were £40,911, up 4.5%. The annual figure covers a narrower group, so the two cannot be converted into each other.
What is the median salary in the UK by sector?
Payroll data for September 2026 puts median monthly pay across the highlighted industry sectors between £1,444 in accommodation and food service activities and £4,332 in finance and insurance. By ownership, median gross weekly earnings for full-time employees in April 2026 were £862.20 in the public sector and £794.40 in the private sector.
What is the gender pay gap in the UK?
It was 6.8% for full-time employees in April 2026, down from 7.2% a year earlier, and 12.3% for all employees, down from 13.0%. The gap rises with age, from 0.3% for full-time employees aged 18 to 21 to 11.2% for those aged 60 and over.
Do UK employers have to publish salary ranges?
No. The United Kingdom duty is to report gender pay gap data, and it applies to employers with 250 or more employees on their snapshot date. The EU pay transparency directive gives applicants a right to information on pay before employment, but it applies in EU member states rather than in the UK. Take legal advice on your own position.
Your next step: name the figure, then measure your own
- Decide which question you are answering, a growth rate or a level, and quote the matching series.
- Write the reference period next to every number you use, because all of these move.
- Pick one inflation index for real-terms comparisons and stay with it.
- Run your own median and your own award distribution, split full-time and part-time, before comparing yourself with anything national.
To put a defensible process behind those numbers, read and download our compensation policy guide. The guide is free to read, and the PDF uses our short download form.
Want pay conversations built on evidence gathered through the year? Book a New Dynamics demo and bring your current review form. You can also email contact@new-dynamics.com.