TL;DR
- The disability employment gap was 29.4 percentage points in April to June 2026, with a disability employment rate of 53% against 82.4% for non-disabled people. The Department for Work and Pensions says the historical downward trend has stalled in the last five years.
- The ONS last published ethnicity pay gaps for 2022, when Black, African, Caribbean or Black British employees earned less (£13.53) median gross hourly pay than White employees (£14.35). Ethnicity pay gap reporting is not a legal duty in the UK today, although the government has committed to making it one for employers with 250 or more employees.
- The UK reports 40.2% of managerial positions held by women for 2022, and the gender pay gap for managers, directors and senior officials was 11.4% in April 2026. The employment rate for people aged 50 to 64 was 72.2% in April to June 2026, against 85.1% for those aged 35 to 49.
Most numbers presented as workforce diversity statistics come from employer panels that answered a vendor survey. A handful come from national statistics, cover the whole labour market, and are published with a reference period and a stated geography attached. Those are the ones worth quoting.
This article sets out the official United Kingdom figures on four questions people actually ask: the disability employment gap, the ethnicity pay gap, women in management and the age profile of the workforce. It also says plainly where no official figure exists.
Representation data is only useful next to decision data, and both need to sit in one place. See how New Dynamics performance reviews keep the year's evidence attached to the cycle that sets the rating.
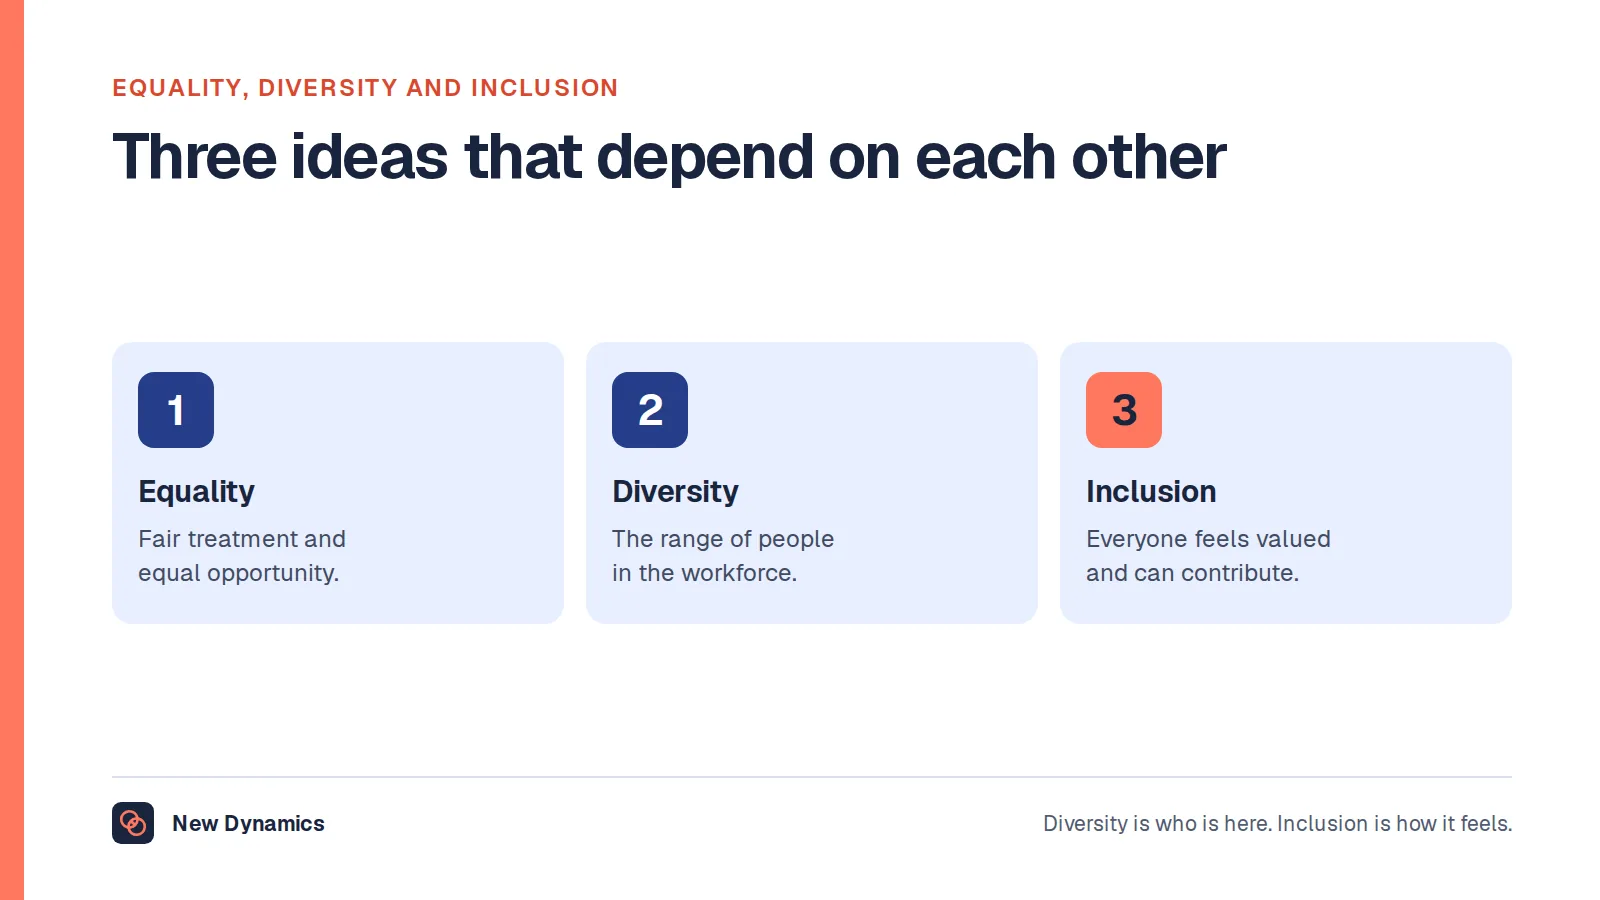
For the wider concept behind these measures, our post on diversity in the workplace covers the definitions.
The disability employment gap in the UK
This is the best maintained diversity statistic in the country. The Department for Work and Pensions publishes it annually in "The employment of disabled people", and the edition released on 4 November 2026 covers April to June 2026 for the United Kingdom.
It reports that "There were 5.6 million disabled people in employment in the UK in April to June 2026", that "the disability employment rate was 53%", "compared to 82.4% for non-disabled people", and that "The disability employment gap was 29.4 percentage points in April to June 2026".
Three qualifications belong with that headline.
The trend has flattened. The release states that "Historical downward trends in the disability employment gap have stalled in the last 5 years." The gap fell by 0.3 percentage points compared with April to June 2025, and the latest estimate was 0.6 percentage points higher than in April to June 2019. The release says neither change was statistically significant, which is the publisher telling you not to read a direction into either.
The gap widens with age. It was 22.1 percentage points for people aged 18 to 24 and 33.1 percentage points for those aged 50 to 64. An age policy and a disability policy are the same policy for a large group of people.
It varies by place and by circumstance. The release reports a wider gap for males, for older people, for people with no qualifications, for people living in social housing, for people not living in a couple, and for people living in Northern Ireland, Scotland, the North of England, the West Midlands and Wales.

Ethnicity pay gap statistics, and what the law actually requires
Here the data is thinner and older than most people assume. The Office for National Statistics release "Ethnicity pay gaps, UK" is an article rather than a regular bulletin, and the most recent edition covers 2012 to 2022 and was released on 29 November 2023. It draws on the Annual Population Survey, covers the United Kingdom for the five-category ethnicity breakdown, and narrows to England and Wales for the eighteen-category breakdown.
It reports that "Black, African, Caribbean or Black British employees earned less (£13.53) median gross hourly pay than White employees (£14.35)", which it notes has been consistent since 2012. Asian or Asian British employees earned more than White employees in 2022, a pay gap of negative 3.3%.
Country of birth changes the picture substantially. The same release reports that "UK-born Black, African, Caribbean or Black British employees earned more (£15.18), while non-UK-born Black British employees earned less (£12.95)". Adjusting for personal and work characteristics reverses several raw gaps: UK-born Black, African, Caribbean or Black British employees move from earning 6.5% more to earning 5.6% less than White employees, and UK-born Asian or Asian British employees from 11.9% more to 1.9% less. Occupation, qualifications, geography, age and sex are the five factors the analysis identifies.
A single national ethnicity pay gap figure therefore does not exist in any useful form. The published gaps run in both directions depending on the group, where people were born and which characteristics are controlled for.
Is ethnicity pay gap reporting mandatory in the UK?
Not today. State this precisely, because the position changed recently and is still changing.
The duty that is in force is the gender one. The gov.uk guidance states that "Any employer with 250 or more employees on a specific date each year (the 'snapshot date') must report their gender pay gap data" and that "You must report and publish your gender pay gap information within a year of your snapshot date."
For ethnicity and disability, there is a government commitment rather than a duty. The announcement of 25 March 2026 says that "Firms with 250 or more employees will be required to publish 6 key pay-gap metrics" along with new workforce composition data. The consultation response published the same day sets out the six measures as the ones already used for gender pay gap reporting: mean and median differences in hourly pay, pay quarters, mean and median differences in bonus pay, and the percentage of employees receiving bonus pay. It also covers workforce reporting, self-declaration rates and actions inside equality action plans.
The response says the government intends to take these forward and will continue to develop legislation. No commencement date is given. The territorial position is not uniform either: the proposals apply to the private and voluntary sectors across Great Britain, and to public sector bodies in England, with some cross-Great Britain public authorities covered for non-devolved functions.
So an employer in Northern Ireland, an employer in Scotland and a public body in Wales are not all in the same position. This article is general information about published statistics and published policy, not legal advice. Take advice on your own obligations before you write anything into a policy.
Women in management statistics in the UK
The United Kingdom reports this as part of its Sustainable Development Goals data, and the ONS runs the platform. Indicator 5.5.2, the proportion of women in managerial positions, is reported as 40.2% for 2022, calculated as the number of female senior and middle managers divided by the number of senior and middle managers. The indicator page names the ONS as the source and was last updated on 21 August 2023. It also records that the occupational classification changed in 2021, from SOC2010 codes to SOC2020 codes, which matters when comparing years across that break.
For scale, the Census 2021 bulletin on industry and occupation, released on 8 December 2022 and covering England and Wales on census day of 21 March 2021, reports that 12.8% of usual residents aged 16 and over in employment worked "as managers, directors and senior officials (12.8%, 3.5 million)". Professional occupations were larger, at 20.2% and 5.6 million people.
Pay inside that group is where the gap shows. The ONS "Gender pay gap in the UK" release of 22 October 2026, covering April 2026 for the United Kingdom, reports that "The gender pay gap for full-time employees has continued to decline in the UK. It was 6.8% in April 2026, down from 7.2% in April 2025." For managers, directors and senior officials the gap was 11.4%, well above the all-employee full-time figure, and among the largest of the three highest-paid occupation groups.
The release also notes that "the proportion of women in high-paying occupations also decreases with age". In professional occupations, women were 50.1% of employees aged 22 to 29 and 45.2% of those aged 50 to 59.

One large employer publishes its own figures in enough detail to be useful as a comparison. Civil Service Statistics 2026, published on 28 October 2026 for the position as at 31 March 2026, reports that "49.8% of those at SCS level are women compared to 49.2% in 2025 and 40.1% in 2016", alongside a headcount of 304,760 women and 252,410 men. The same bulletin records that "19.2% are from an ethnic minority background, up from 18.0% in 2025" and "18.4% declare themselves as having a disability, up from 17.9% in 2025". Read those as one employer's numbers, not as a national benchmark.
The age of the UK workforce
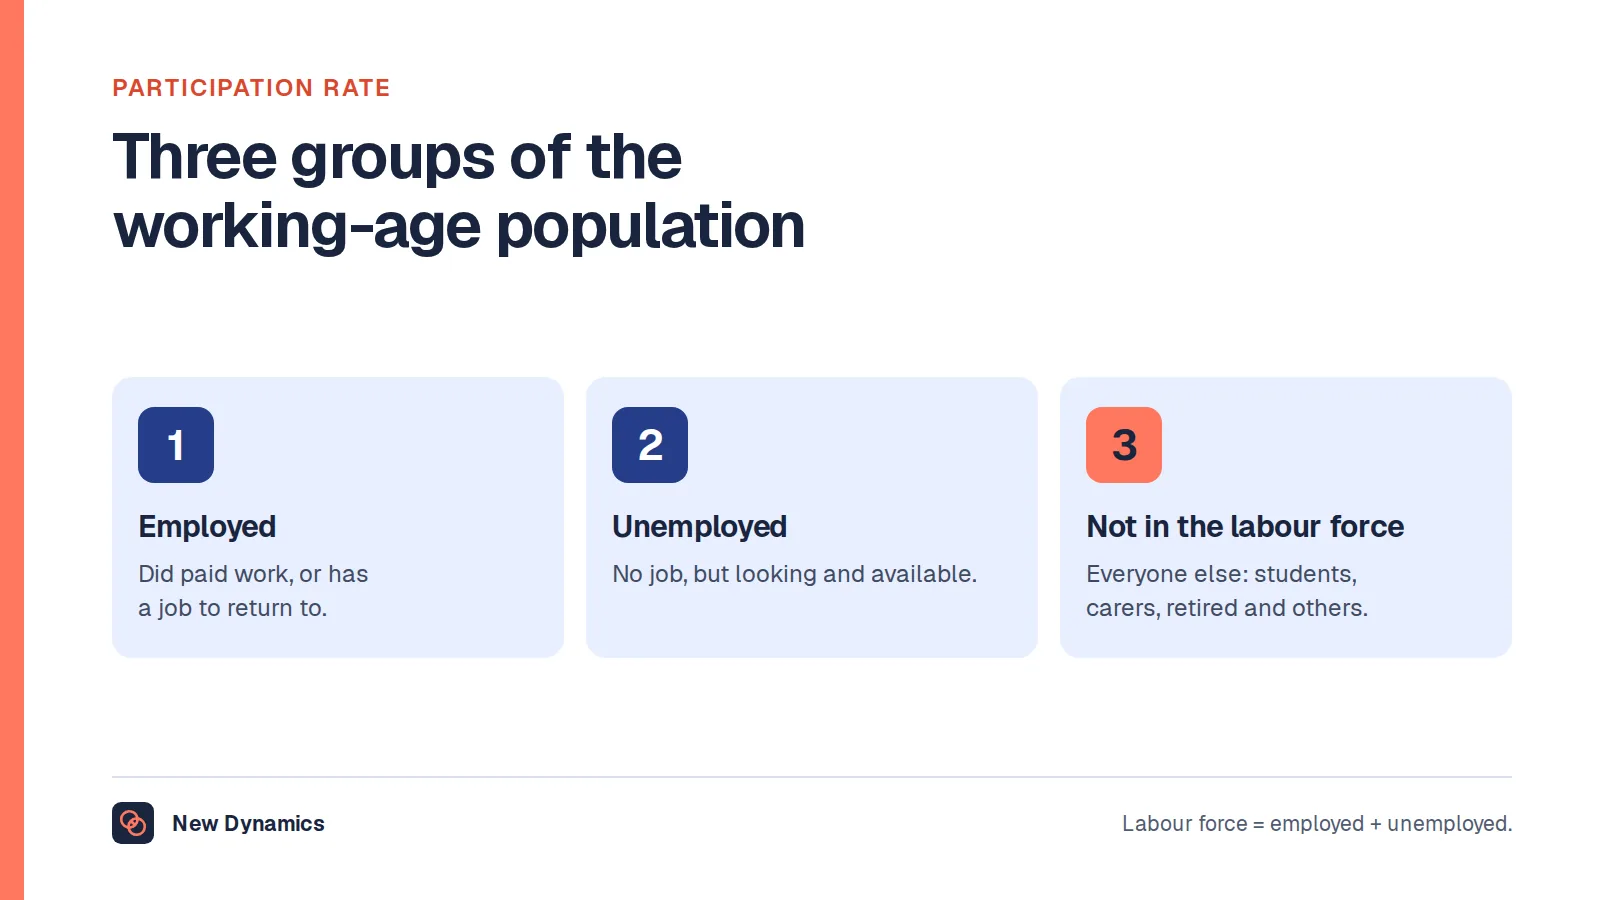
Start with the whole-economy figure. The ONS "Labour market overview, UK" released on 20 October 2026 puts the employment rate for people aged 16 to 64 at "75.3% for June to August 2026", with unemployment at 4.7% for those aged 16 and over and economic inactivity at 20.9% for those aged 16 to 64.
The age split comes from the Department for Work and Pensions series on people aged 50 and over, published on 24 September 2026 and covering April to June 2026 for the United Kingdom. It reports that "The employment rate for people aged 50 to 64 years was 72.2% in 2026", against 85.1% for those aged 35 to 49, a gap of 12.9 percentage points. Economic inactivity for the 50 to 64 group was 25.7%.
The drop around state pension age is abrupt. The same release reports that "In 2026, at age 65 years, the employment rate was 46.6%, which then decreased at age 66 years to 33.1%." It also records that between July 2025 and July 2026 the number of payrolled employees aged 50 to 64 decreased by 81,000, or 1.0%, to 8.06 million.
At the other end, the ONS bulletin on young people not in education, employment or training, released on 27 August 2026, reports that "There were an estimated 981,000 young people aged 16 to 24 years in the UK who were NEET in April to June 2026" and that "The percentage of all young people in the UK who were NEET in April to June 2026 was 13.0%".
Put together, the age profile of the workforce is squeezed at both ends: nearly one in seven young people outside work and study, and a quarter of people aged 50 to 64 economically inactive.
Workforce diversity statistics by ethnicity and disability in the census
Two further official sources fill in the picture, and both are older than the labour market series.
The ONS article "Diversity in the labour market, England and Wales", released on 25 September 2023 and based on census day of 21 March 2021, reports that "Males (61.4%) were more likely to be employed than females (53.2%)" and that "Non-disabled adults were more than twice as likely to be in employment (64.7%) than disabled adults (27.3%)". Across ethnic groups it reports a range from 74.4% employed in the "White: Other White" group to 37.4% in the "White: Gypsy or Irish Traveller" group. Those are percentages of all adults aged 16 and over, not of the working-age population, which is why they look low next to the labour market figures above.
The government's ethnicity facts and figures service, using the Annual Population Survey, reports that "76% of working age people (16 to 64 year olds) in England, Scotland and Wales were employed in 2022", with 82% in the "white other" group the highest of all ethnic groups and 61% in the combined Pakistani and Bangladeshi group the lowest. On occupation, for 2021, it reports 10.7% of white British workers and 4.6% of black workers working as managers, directors and senior officials, with 13.5% of white Irish workers and 10.6% of workers from the Indian ethnic group in those roles.

What no official statistic will tell you
- A current single national ethnicity pay gap. The latest ONS article covers 2022 and reports gaps running in both directions by group.
- A national disability pay gap for employers. The reporting duty is not in force, so no employer-level series exists.
- How many employers publish diversity data voluntarily. Not measured in the United Kingdom by anybody official.
- Representation at board or executive level across the whole economy. The published occupation groups stop well above that.
- Whether your own promotion and rating decisions are even-handed. That evidence sits inside your organisation, uncounted until you count it.
What to measure in your own organisation
- Declaration rates before gaps. A disability pay gap built on a 30% declaration rate describes the people who told you, not your workforce.
- Representation by level, not only in total. A balanced headcount with an unbalanced management layer is the pattern the national figures keep showing.
- Your rating distribution split by group, with a threshold that protects anonymity, because that is where pay and promotion decisions begin.
- Progression rates, not just hiring rates. Hiring fixes the bottom of the pyramid and leaves the middle alone.
- Your age profile against the 50 to 64 inactivity figure, which tells you how much experience the labour market is currently leaving on the table.
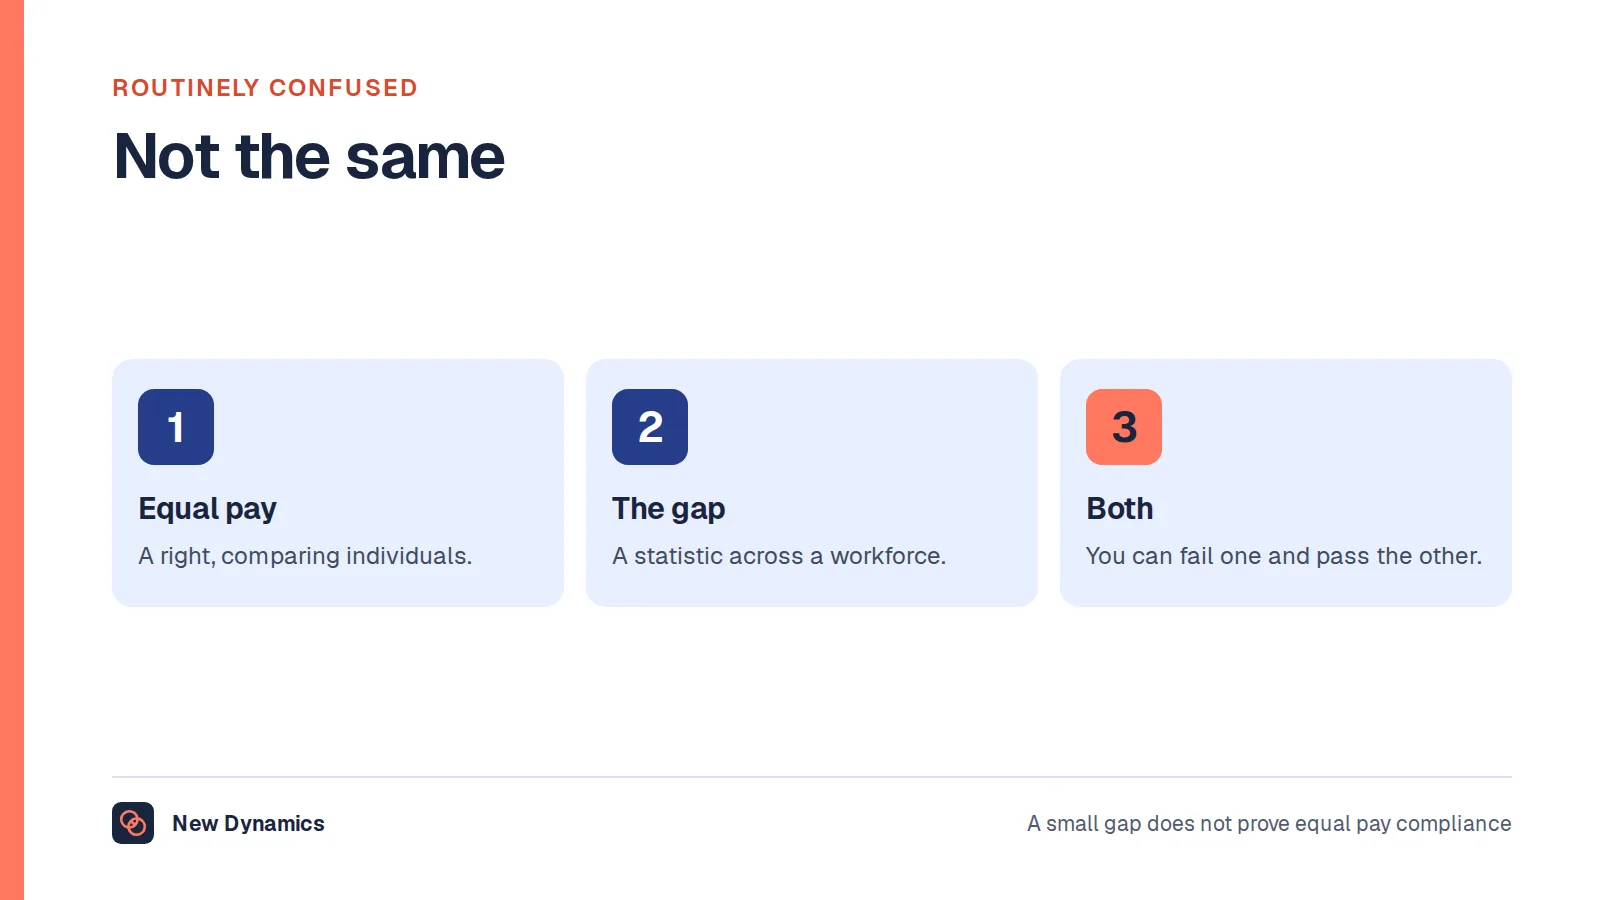
For the wider set of published United Kingdom figures on work, pay and the workforce, our HR statistics hub collects them with the publisher and the period attached. Our post on pay equity explains why a pay gap and an equal pay problem are different things.
What usually goes wrong
- Quoting the disability employment gap as a rate. It is 29.4 percentage points, the difference between 53% and 82.4%, not a percentage of anything.
- Treating the ethnicity pay gap as one number. The published gaps differ by group, by country of birth and by whether characteristics are controlled for.
- Writing a mandatory ethnicity reporting duty into a policy. It is a commitment with no commencement date, and its territorial scope is not uniform.
- Mixing census employment percentages with labour market rates. One covers all adults aged 16 and over, the other the working-age population.
- Comparing yourself with the Civil Service figures as a benchmark. They are one employer's numbers, published in unusual detail.
- Reading a statistically insignificant movement as progress. The publisher says when a change is not significant, and that warning is part of the figure.
Frequently asked questions
What is the disability employment gap in the UK?
It was 29.4 percentage points in April to June 2026, the difference between a disability employment rate of 53% and a rate of 82.4% for non-disabled people. There were 5.6 million disabled people in employment in the UK over that period. The Department for Work and Pensions says the historical downward trend in the gap has stalled in the last five years.
What is the ethnicity pay gap in the UK?
There is no single figure. For 2022, the ONS reports that Black, African, Caribbean or Black British employees earned less in median gross hourly pay, at £13.53, than White employees at £14.35, while Asian or Asian British employees earned more, a gap of negative 3.3%. Country of birth and the characteristics controlled for both change the result.
Is ethnicity pay gap reporting mandatory in the UK?
No. The duty in force applies to the gender pay gap only, for employers with 250 or more employees on their snapshot date. In March 2026 the government committed to mandatory ethnicity and disability pay gap reporting using the same six measures, for employers with 250 or more employees, but no commencement date has been set. This is general information rather than legal advice.
What proportion of managers in the UK are women?
The United Kingdom reports 40.2% of managerial positions held by women for 2022, under Sustainable Development Goal indicator 5.5.2, counting senior and middle managers. The gender pay gap within that group was 11.4% in April 2026, against 6.8% for all full-time employees.
What is the age profile of the UK workforce?
The employment rate for people aged 16 to 64 was 75.3% for June to August 2026. By age band, it was 85.1% for people aged 35 to 49 and 72.2% for those aged 50 to 64, with 25.7% of the 50 to 64 group economically inactive. At age 65 the rate was 46.6%, falling to 33.1% at age 66.
Which of these figures cover the whole UK?
Not all of them. The disability employment gap, the gender pay gap, the labour market overview and the NEET figures cover the United Kingdom. The census figures on occupation and employment cover England and Wales. The employment rate by ethnic group covers England, Scotland and Wales. The ethnicity pay gap covers the UK for the five-category breakdown and England and Wales for the eighteen-category one.
Your next step: name the source, then measure your own
- Decide which question you are answering, a gap or a representation share, and quote the matching series with its reference period.
- Write the geography next to every figure, because several of these are Great Britain or England and Wales rather than the United Kingdom.
- Check your own declaration rates before you publish any gap built on self-reported data.
- Split your rating and promotion distributions by group, with a threshold that protects anonymity, and keep the method stable so next year is comparable.
To put a defensible process behind those numbers, read and download our diversity and inclusion guide. The guide is free to read, and the PDF uses our short download form.
Want representation and progression data sitting next to the review evidence that produced it? Book a New Dynamics demo and bring last cycle's rating distribution. You can also email contact@new-dynamics.com.