TL;DR
- For the year to Quarter 2 (Apr to Jun) 2026, the ONS flash estimate using payroll data put output per hour 0.7% higher and output per worker 1.4% higher than a year earlier. Estimates based on the Labour Force Survey for the same quarter put output per hour 0.2% lower and output per worker 0.4% higher.
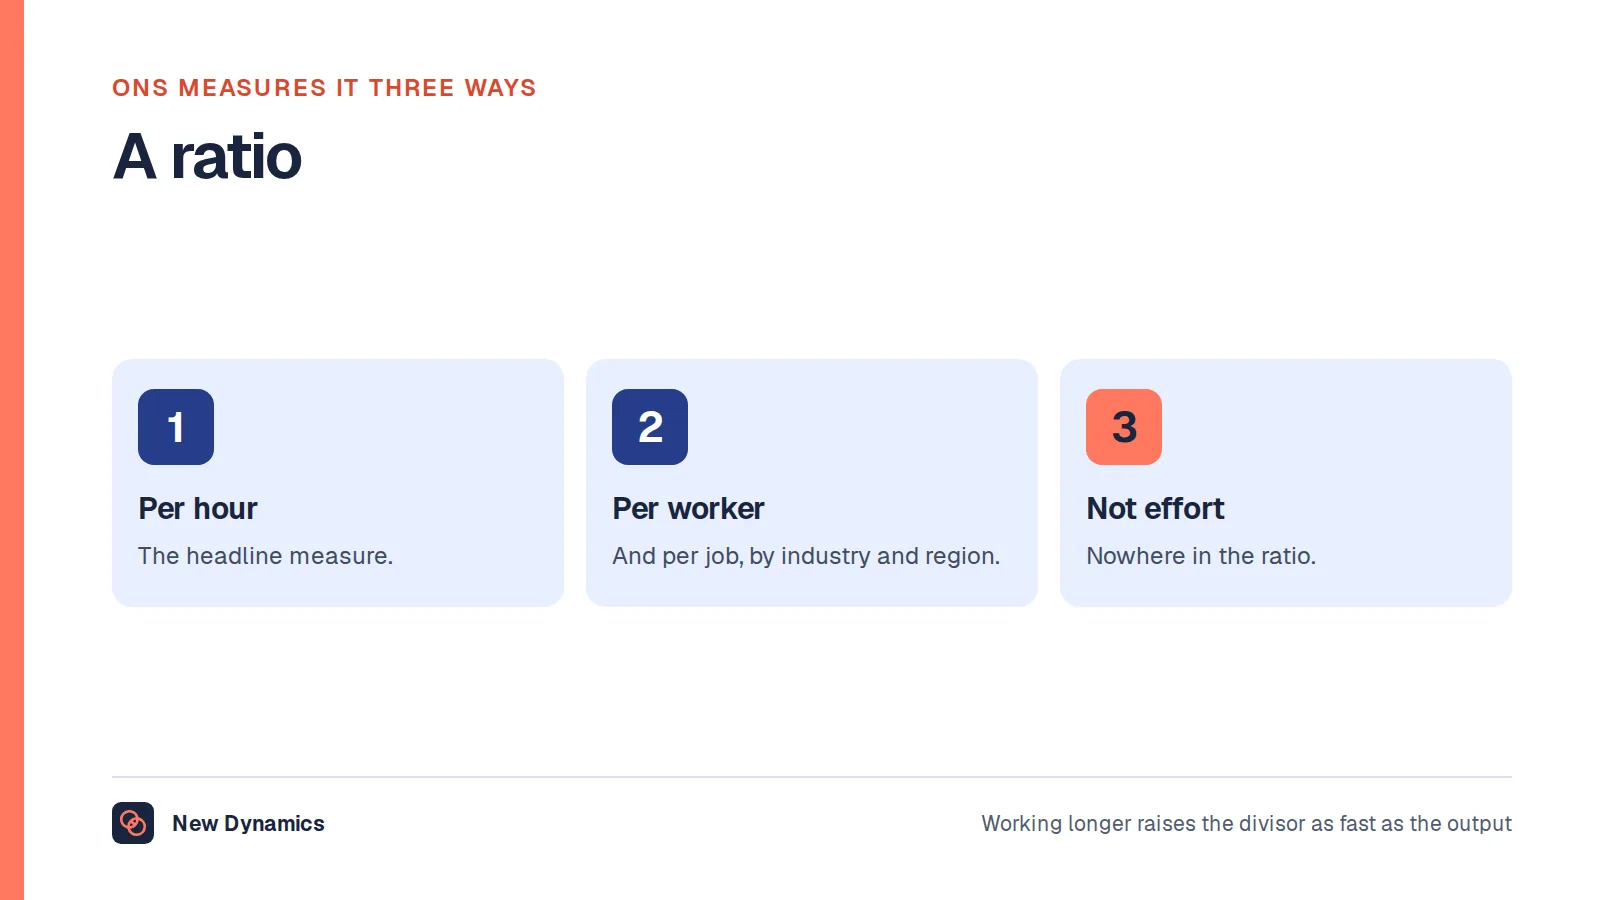
- Output per hour, output per worker and output per job divide the same output by three different denominators. Output per hour is the ONS preferred measure because it accounts for different working patterns, so a shift in part-time hours alone can move the other two.
- The sector figures are about industries, not about individuals. The ONS Management and Expectations Survey found that a 1% increase in a firm's labour productivity is correlated with a 0.02 increase in its management practice score, and that score is built from targets, performance indicators and employment practices.
Ask what UK labour productivity did last quarter and the honest answer is that the official statistics give you two numbers with different signs. One says output per hour rose. One says it fell. Both come from the Office for National Statistics, both cover the same three months, and the difference is the data source rather than the economy.
This article sets out which figure is which, what output per hour worked actually measures, how it varies by sector, and what an employer can sensibly do with any of it.
Productivity moves when people know what they are working towards and the measure is agreed in advance. See how New Dynamics goals and OKRs keep the target, the owner and the evidence in one place.
For the measure at team level rather than national level, our post on employee productivity covers what is worth counting inside an organisation.
The headline UK labour productivity figures
The current source is the ONS Productivity flash estimate and overview. The release of 18 August 2026 covers Quarter 2 (Apr to Jun) 2026, and the next release is dated 17 November 2026.
On the payroll data, it reports that "The flash estimate of labour productivity, primarily using Pay As You Earn (PAYE) RTI data for Quarter 2 (Apr to Jun) 2026 shows output per hour and output per worker were 0.7% and 1.4% higher in the year to Quarter 2 2026, respectively, compared with Quarter 2 2025."
On the survey data, the same release reports that "Estimates based on the LFS indicate output per hour worked in the year to Quarter 2 (Apr to Jun) 2026 was 0.2% lower compared with Quarter 2 2025, while output per worker increased by 0.4% compared with the same period."
Against the pre-pandemic benchmark the gap is wider still. The release states that "Output per hour worked growth produced using administrative data methods with different data sources was 4.6% above its pre-coronavirus (COVID-19) pandemic levels (2019 average level) in Quarter 2 (Apr to Jun) 2026", while "Output per hour worked growth produced using LFS sources was 2.3% above its pre-coronavirus (COVID-19) pandemic levels (2019 average level)" in the same quarter.

Two housekeeping points before anyone quotes these. The ONS says in the same release that "We currently recommend using the RTI-based measure", so the payroll figures are the ones to lead with. And the release notes that "The labour market and productivity statistics in this article are labelled as 'official statistics in development'", which is a formal status, not a disclaimer to skip over.
There is one trap worth naming. The old quarterly Labour productivity bulletin is still reachable at a URL ending in "latest", and it serves a release from 7 April 2020 covering Quarter 4 (Oct to Dec) 2019. If a figure looks oddly small, check the reference period on the page rather than the position of the link.
Output per hour, output per worker and output per job are not the same thing
Three measures share the name labour productivity. The ONS Labour productivity quality and methodology information, published 15 November 2024, defines each of them, and the differences matter more than they look.
"Labour productivity is defined as output per unit of labour input and shows changes in output over time for the same amount of labour input." The three measures differ only in what counts as that input.
Output per hour worked. The ONS states that "Output per hour is our preferred measure of labour productivity because it accounts for different working patterns; it is calculated for the whole economy and for each industry by dividing gross value added (GVA) by hours worked for that industry."
Output per worker. Calculated by dividing GVA by the number of workers, where "A 'worker' refers to an individual employed in any capacity, whether full-time or part-time, and regardless of the number of jobs they hold."
Output per job. Calculated by dividing GVA by the number of jobs, where "A 'job' refers to a specific position of employment, which could be full-time or part-time."

Here is why that is not pedantry. If a workforce moves from full-time to four days a week and output holds, output per hour rises while output per worker stays flat. If people take second jobs, the worker count and the job count stop tracking each other. In the year to Quarter 2 2026 the payroll figures showed output per worker up 1.4% against output per hour up 0.7%, and the honest reading of that gap is average hours, not effort.
So when a board paper says "productivity is up 1.4%", the first question is what sat on the bottom of the fraction.
Why two official numbers disagree in the same release
The two estimates differ because the labour input is counted differently. The ONS explains that "Enhancements to the LFS, introduced since January 2024, mean that movements in the LFS since then reflect both underlying developments in the economy and improved survey quality, including obtaining more responses from employed people", with the consequence that "recent LFS measures of employment growth are likely to be temporarily higher while recent LFS measures of productivity growth are likely to be temporarily lower."
The ONS has also changed how it measures hours. An ONS blog post of 17 September 2026 by Cliodhna Taylor describes a component method built by taking "the total number of usual hours per job from the large ONS Annual Survey of Hours and Earnings (ASHE)" and deducting hours of leave. It notes that on the original estimates "productivity grew at an average annual rate of 2.1% before 2008 and 0.7% thereafter", while on the new approach "productivity grew a little slower before 2008, at 2.0%, while it grew at an average of 1.3% from 2009 to 2019". The post says the revisions "reduce the size of the productivity slowdown by around half", and that the method will be "introduced from the November 2026 quarterly bulletin".
Read that for what it is. Part of the famous UK productivity puzzle was a measurement problem, and the rest of it is still there.
Labour productivity by sector in the UK
Sector detail is published as each industry's contribution to whole economy productivity rather than as a league table of levels.
The August 2026 release reports that "The information and communication industry made the largest upward contribution to productivity growth (2.8%), compared with 2019 (average)", and that "Human health and social work activities made the largest negative contribution to productivity growth (negative 0.9%) over the same period."
It also warns that "The large decrease in output per hour in the electricity, gas, steam and air conditioning supply industry should be treated with caution", which is a useful reminder that a dramatic sector number is sometimes a measurement artefact.
Public services are measured on a separate basis, because much of their output is not sold. The ONS bulletin Public service productivity, quarterly, UK, released on 7 August 2026 and covering January to March 2026, reports that "Total public service productivity (TPSP) increased by 0.7% in 2024 and 0.9% in 2025", that "TPSP was 2.5% lower than the pre-coronavirus (COVID-19) pandemic 2019 level", and that healthcare productivity "increased by 1.1% in 2024 and 1.0% in 2025" while remaining "5.8% lower in 2025 than the pre-pandemic 2019 level".
A sector figure describes an industry, including its capital, its technology and its mix of firms. It does not describe a team inside that industry, and it is a poor benchmark for one.
The G7 comparison, and why it is harder to find now
The ONS used to publish the international comparison directly. International comparisons of UK productivity (ICP), final estimates, released on 11 January 2023 and covering 2021, reports that "In 2021, the UK's output per hour worked was lower than France, Germany and the United States, but higher than Canada and Italy when using the component method." In current prices on that method, UK output per hour worked was £46.92, against £55.50 in France, £55.83 in Germany, £58.88 in the United States, £45.33 in Italy and £42.94 in Canada.
That release also states that "This is the last planned release of International Comparisons of Productivity." So the UK versus G7 comparison exists, it is from 2021, and the ONS no longer updates it. Anyone quoting a fresher G7 gap is quoting somebody else's calculation, usually from OECD data, and should say so.
The management practice link, which is the part HR can act on
National productivity is mostly out of an HR team's hands. Management practice is not, and the ONS has measured the association.
The bulletin Management practices in the UK: 2016 to 2023, released on 13 May 2024, draws on the Management and Expectations Survey, which "went out to 53,433 businesses between November 2023 and February 2024". It reports that "Our third survey of management practices saw higher average scores of 0.55 in 2023, up from 0.49 in 2020, on a scale from 0 (no implementation of structured management practices) to 1 (full implementation)", driven by improvement among firms below the median.
On the link with productivity, the bulletin states that "A 1% increase in a firm's labour productivity is correlated with a 0.02 increase in its management practice score." That is a correlation, and the direction of cause is not settled by it.
The score is not a vague culture index. The bulletin says the scores "capture four dimensions of management: continuous improvement, or how businesses respond to problems; the use of key performance indicators (KPIs); the use of targets; employment practices relating to promotion, training and employee underperformance".

The breakdowns are the interesting part for anyone designing a people process.
- By sector, "Firms in the services sector had higher average management scores (0.56) than firms in the production sector (0.52) in 2023", with information and communication services highest at 0.64 and transportation and storage lowest at 0.46.
- By size, "firms with more than 250 employees scored on average 0.68 compared with 0.65 for firms with 100 to 249 employees, 0.63 for firms with 50 to 99 employees, 0.58 for firms with 20 to 49 employees, and 0.51 for firms with 10 to 19 employees".
- On evidence, "Firms with below median management scores in 2023 were four times more likely to use little to no analysis to support business decisions."
- On action, "Almost 9 in 10 (89%) of firms surveyed in 2023 report taking some action to improve management quality; of those, 64% said they consulted employees about areas of improvement and 43% carried out formal training online, 42% in person and 13% participated in government training programmes."
Three of those four dimensions are things a people team already owns: targets, indicators and the employment practices around promotion, training and underperformance.
Productivity is not a performance rating
The temptation, once productivity figures are on the table, is to convert them into individual judgements. Resist it, for reasons that are practical rather than squeamish.
The national measure divides money by time. Gross value added per hour is an economic aggregate. It responds to prices, capital investment, industry mix and demand. None of those sit inside one person's objectives.
Output per person is mostly not attributable. In most jobs output is produced by a team, a system and a set of tools. Dividing the team's output by headcount tells you about the system, and attributing the result to individuals is a measurement error with consequences.
What gets counted gets gamed. A measure that drives pay or rating will be optimised, including in ways that lower real output. Volume rises, quality falls, and the number keeps looking good.
Hours in the denominator cut both ways. Output per hour improves if hours fall and output holds. Treated as a performance target, that invites unrecorded overtime, which improves the metric and nothing else. Our post on labour costs covers the cost side of the same arithmetic.
So the honest use of productivity statistics in an organisation is diagnostic. They tell you where to look. They do not tell you who to rate.
What to measure inside your own organisation instead
- One output measure per team, agreed before the period starts. Deliveries completed, cases closed, units shipped. Agreed in advance, so nobody argues about the definition after the result is known.
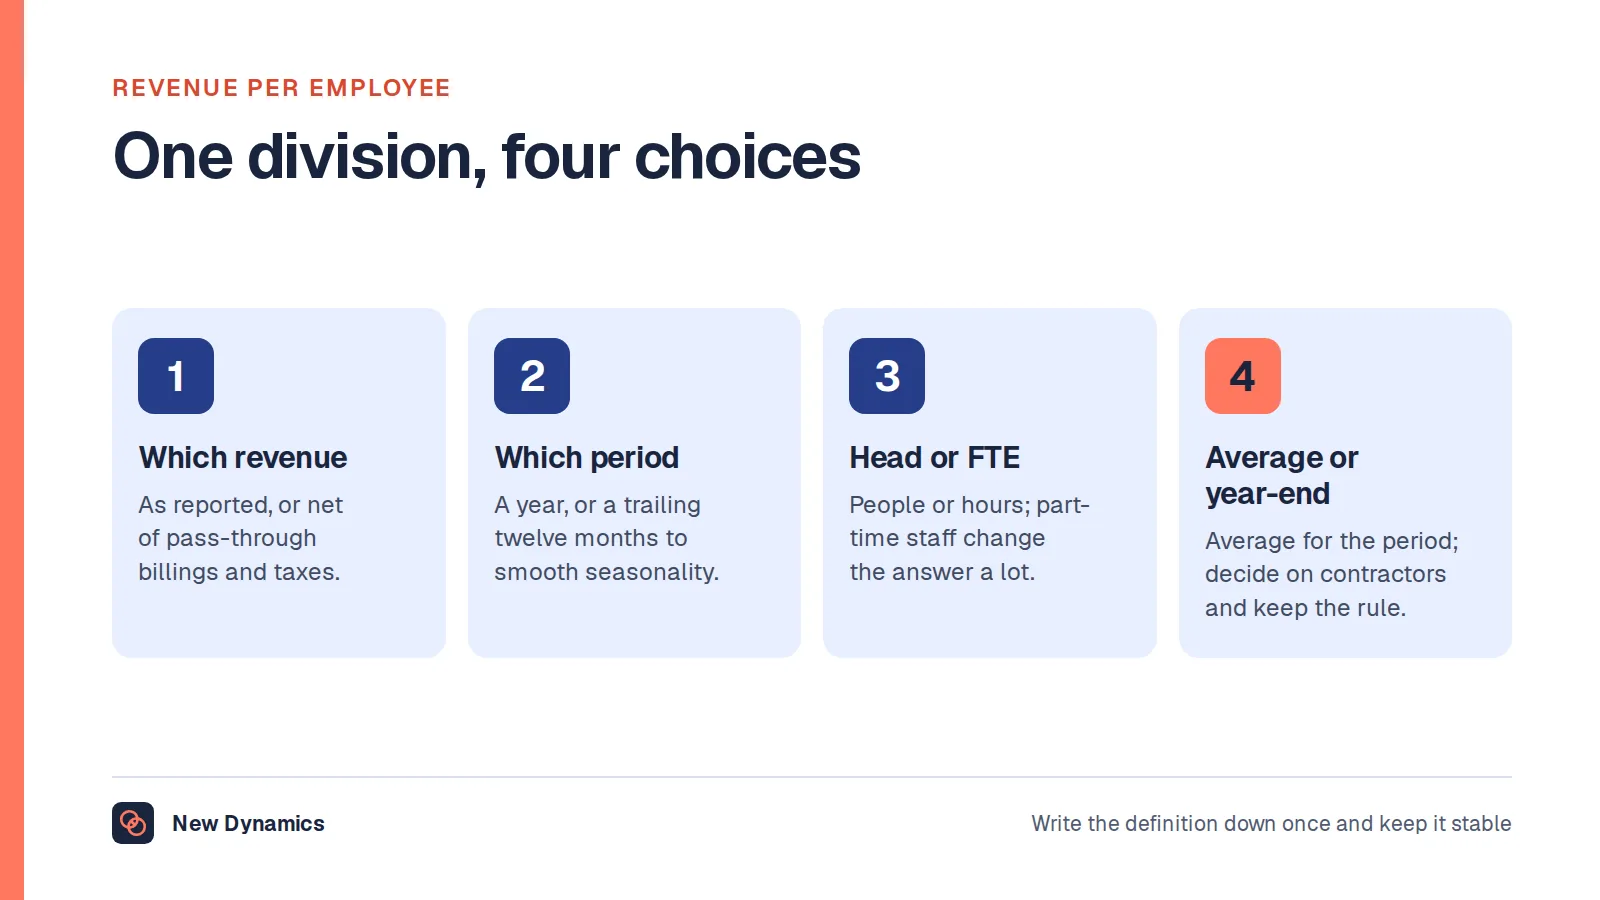
- The same denominator every time. Pick hours, people or roles, write the choice down, and keep it. Mixing them produces trends that are really changes in working patterns. Our post on revenue per employee covers the headcount version and what it hides.
- Quality alongside volume. Rework, error rates, complaints, returns. Without these, any productivity measure can be improved by doing the job worse.
- Time lost to the process itself. Approvals waiting, handovers, duplicate data entry, chasing. This is usually where the recoverable time is, and it is a system problem rather than an effort problem.
- The management practices the ONS score counts. Do teams have targets? Are results tracked? Are promotion, training and underperformance handled consistently? Our post on HR metrics sets out how to keep that set small enough to act on.
- Capability coverage, not individual output. Who can do what, and where a single point of failure is throttling throughput.
For the wider set of published UK figures on work, pay and the workforce, our HR statistics hub collects them with the publisher and the period attached.
What usually goes wrong when people quote these figures
- Quoting output per worker as output per hour. They were 1.4% and 0.7% in the same quarter. The gap is hours.
- Using the survey figure and the payroll figure interchangeably, when one showed a rise and the other a fall for the same three months.
- Taking a figure from a page whose URL says "latest", without checking that the reference period is recent.
- Comparing a pre-revision productivity trend with a post-revision one, after a method change that halved the measured slowdown.
- Treating a sector contribution as a benchmark for a team, when it describes an industry's capital and composition.
- Quoting a current UK versus G7 productivity gap from the ONS, which stopped publishing that comparison after the 2021 estimates.
- Turning a national measure into an individual rating, which measures the system and blames the person.
Frequently asked questions
What is UK labour productivity, in one sentence?
The ONS defines labour productivity as output per unit of labour input, which shows changes in output over time for the same amount of labour input. In practice that means gross value added divided by hours worked, by workers, or by jobs, depending on which of the three published measures you are reading.
What is the latest figure for output per hour worked in the UK?
The ONS flash estimate released on 18 August 2026 put output per hour 0.7% higher and output per worker 1.4% higher in the year to Quarter 2 (Apr to Jun) 2026 than a year earlier, using payroll data. Estimates based on the Labour Force Survey for the same quarter showed output per hour 0.2% lower and output per worker 0.4% higher.
What is the difference between output per hour, output per worker and output per job?
They divide the same output by different labour inputs. Output per hour divides gross value added by hours worked and is the ONS preferred measure because it accounts for different working patterns. Output per worker divides by individuals, regardless of how many jobs they hold. Output per job divides by positions of employment, so one person with two jobs counts twice.
Which UK sectors have the highest labour productivity?
The ONS publishes sector detail as a contribution to whole economy productivity growth rather than as a ranking of levels. For Quarter 2 2026 against the 2019 average, information and communication made the largest upward contribution at 2.8%, and human health and social work activities made the largest negative contribution at negative 0.9%.
How does UK productivity compare with the G7?
The last ONS international comparison, released on 11 January 2023 for 2021, found UK output per hour worked lower than France, Germany and the United States but higher than Canada and Italy, at £46.92 an hour in current prices on the component method. The ONS has discontinued that series, so there is no newer official UK comparison of this kind.
Can I use productivity statistics in performance reviews?
Not as a rating input. National and sector figures measure an economy, not a person, and output per head inside a team mostly reflects the system people work in. Use them to decide where to investigate, then measure agreed team outputs, quality and the time lost to your own process.
Your next step: name the measure, then measure your own
- Decide which published measure answers your question, output per hour, per worker or per job, and quote it with its reference period.
- Use the payroll based estimate the ONS currently recommends, and say which source you used.
- Pick one output measure and one denominator for each team, write both down, and keep them stable long enough for a trend to mean something.
- Add a quality measure beside every volume measure, so an improvement has to be real.
- Review the four management practices the ONS score counts, and fix the weakest one before buying anything.
To put targets and owners behind those measures, read and download our OKR guide. The guide is free to read, and the PDF uses our short download form.
Want goals, evidence and review conversations in one place rather than three spreadsheets? Book a New Dynamics demo and bring the measures you report today. You can also email contact@new-dynamics.com.