TL;DR
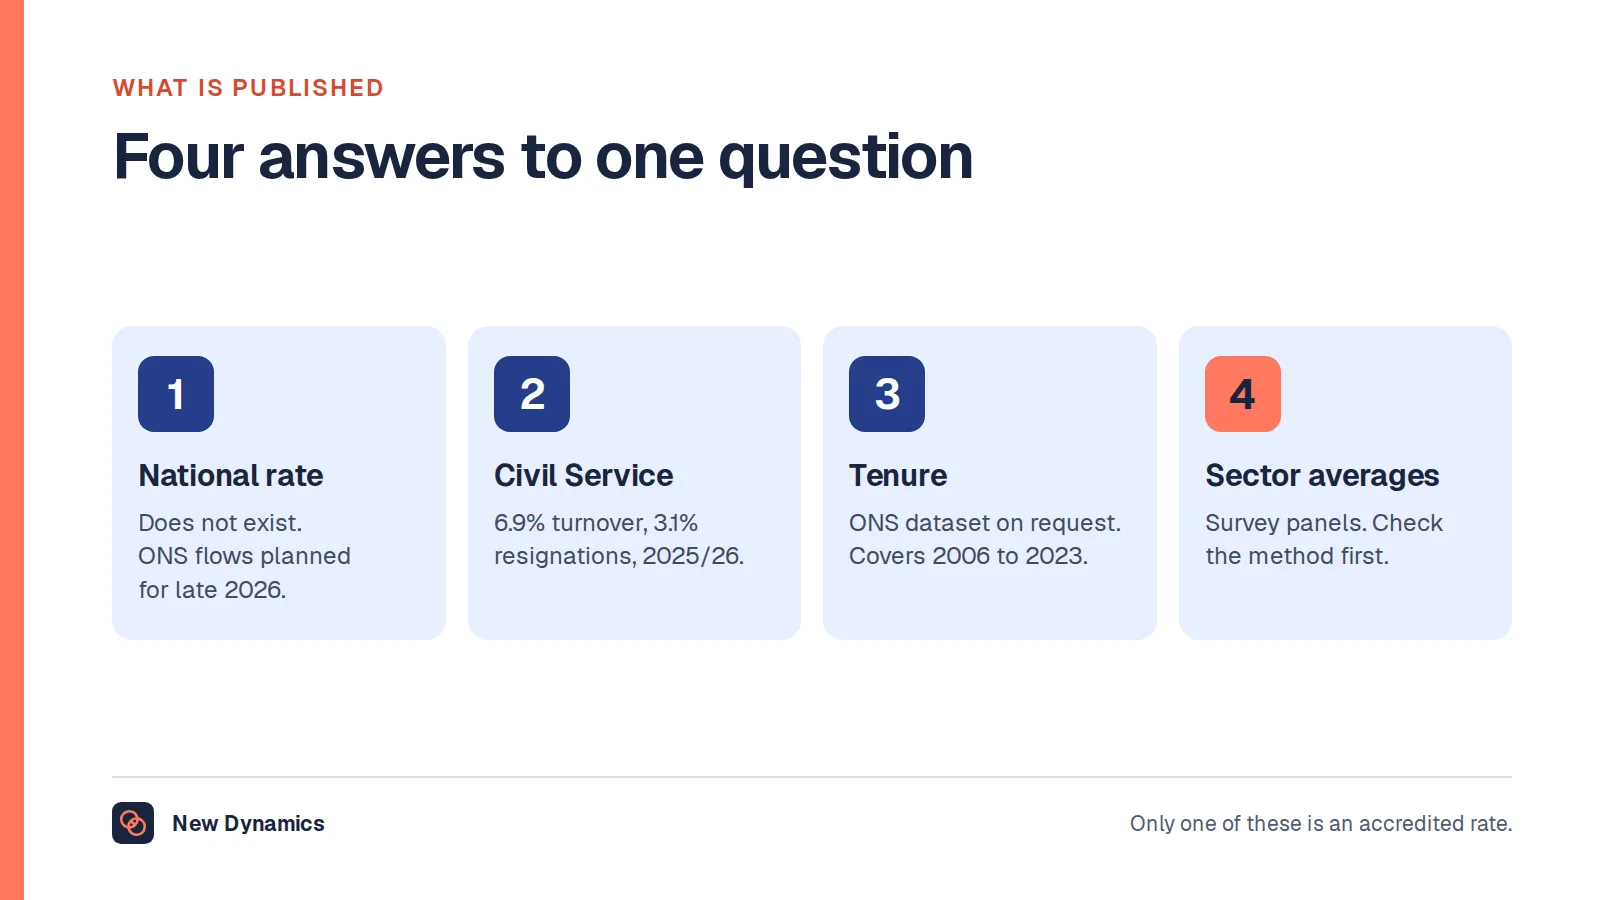
- No official UK source publishes an onboarding completion rate, an average onboarding duration, or a first-year leaver rate. The widely quoted percentages come from vendor surveys, usually without a stated sample.
- The nearest official evidence on early leaving is tenure data. A Department for Business and Trade factsheet records around 6.3 million employees, 22% of all employed 16+, with between six months and two years' service, and the ONS publishes tenure bands on request for 2006 to 2023.
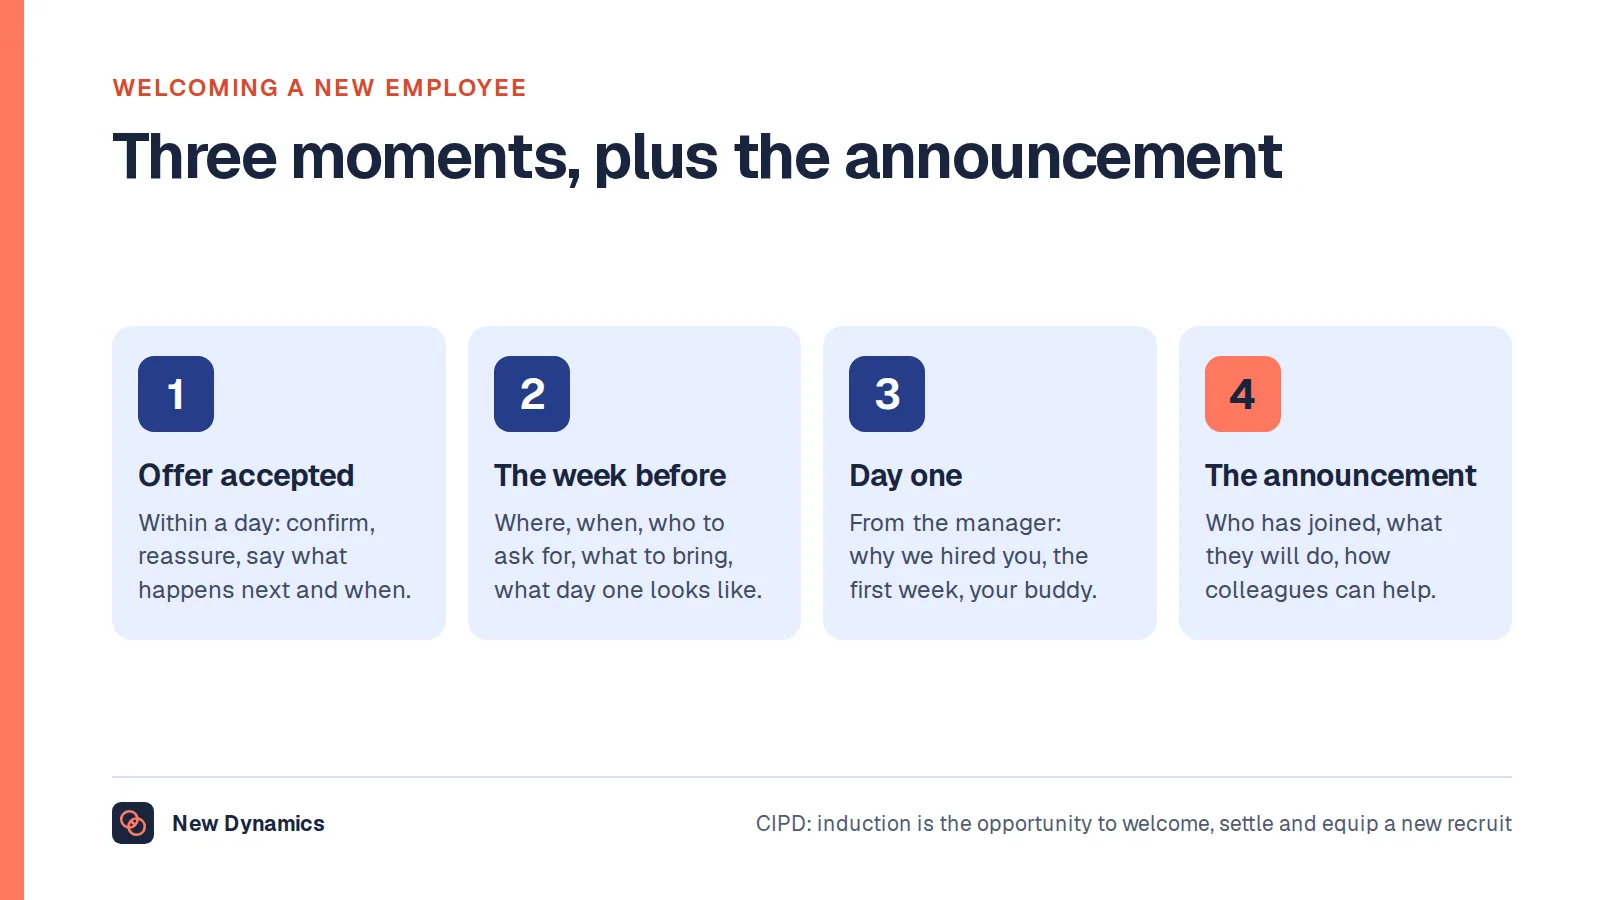
- Onboarding has three duties with dates attached: a right to work check before employment starts, the principal statement of employment particulars on the first day, and the wider written statement within two months. Everything else is yours to design and measure.
Search for onboarding statistics and you will be handed a wall of confident percentages. New starters are more productive by some exact margin. Retention improves by another. Somewhere in the stack, a number claims that most employees decide whether to stay in their first week.
Try to trace any of them. The trail usually ends at a vendor blog quoting a second vendor blog, with no sample, no reference period and no method. The figures are marketing, and they are repeated so often that they have started to look like evidence.
This article does the opposite. It sets out the official United Kingdom figures that touch the start of a job, names what each one actually covers, and then describes the onboarding statistics worth producing from your own records instead.
Onboarding is where tasks, early goals and the first manager conversations either join up or fall apart. See how New Dynamics onboarding keeps them on one path for a new employee.
For the process underneath the numbers, our post on employee orientation covers what a first week should contain.
No official source publishes an onboarding statistic
There is no national figure for how long onboarding takes, how many new starters complete it, or how many leave in their first year. Not from the Office for National Statistics, not from any government department, and not from any accredited series.
This matters more than it sounds. Onboarding completion and onboarding duration describe employer practice, and employer practice is not something United Kingdom official statistics count. The same gap applies to performance review adoption and to turnover definitions, as our post on the UK employee turnover rate sets out in more detail.
So when a figure says that a given percentage of organisations have a structured onboarding programme, or that onboarding takes a particular number of days on average, it is describing whoever answered a survey. If the publisher does not state who was asked, the figure cannot be checked and should not be quoted.

The nearest real evidence on new hire turnover
The honest substitute for new hire turnover statistics is tenure data, which counts how long people have been with their current employer.
The clearest official statement of it appears in the Department for Business and Trade's unfair dismissal factsheet, published among the Employment Rights Act 2025 factsheets (first published 18 October 2024, last updated 15 May 2026). Its key statistics record that "Around 6.3 million employees (22% of all employed 16+) have been working with their current employer for between six months and two years, so have only very limited protection against unfair dismissal."
Read that as a population figure rather than a leaver rate. More than a fifth of employed people are somewhere inside their first two years with an employer. That is the size of the group onboarding is aimed at, and it is large.
The underlying data sits with the ONS, which publishes tenure as a dataset on request rather than as a headline release. The most recent release of that kind, "Employment by duration of employment and age group, UK, 2006 to 2023", was published on 9 May 2024 and is described as "Estimates of employment split by length of time continuously employed with current employer", drawn from the Annual Population Survey.
The spreadsheet covers the period January to December 2006 to 2023 and splits employment into eight bands: "Less than 3 months", "3 months but less than 6", "6 months but less than 12", "1 year but less than 2", "2 years but less than 5", "5 years but less than 10", "10 years but less than 20" and "20 years or more".
Those band boundaries are the useful part. Official statistics cut employment at three months, six months and twelve months, which is exactly where onboarding questions sit. What the data cannot tell you is why anyone moved out of a band. Someone who leaves at month eight and someone promoted internally at month eight look identical in a tenure table.
Even inside official bodies this is not a routine report. An ONS freedom of information response, reference FOI-2026-3481 and released on 24 April 2026, covers a request for its own leavers by tenure bands back to 2000/01. The ONS answered that the request exceeded the cost limit under "s.12 of the Freedom of Information Act 2000 (FOIA)" because the data spans decades across archived systems. A national statistics institute could not readily produce leavers by length of service for itself.
Where official leaver figures stop
Civil Service Statistics is the one accredited source that publishes employer leaver rates, and it is worth knowing exactly how far it goes. The 2026 bulletin, published on 28 October 2026 and measured as at 31 March 2026, reports that "The turnover rate in the Civil Service fell to 6.9% from 7.1% in 2024/25. The resignation rate fell to 3.1% from 3.6% in 2024/25." It also reports that "There were 37,945 leavers from the Civil Service in 2025/26, down from 38,610 in 2024/25", with resignation the most common reason at 17,085 leavers.
That release does not break leavers down by length of service. So even the best published employer leaver data in the country stops short of the first-year figure that onboarding statistics claim to know.
For the wider set of published United Kingdom figures on work, pay and the workforce, our HR statistics hub keeps them with the publisher and the period attached.
What large-scale survey evidence says about new starters
The NHS Staff Survey is the largest regular workforce survey in the country and it does report by length of service. The 2025 national results briefing, published in March 2026, records a 49% response rate, down from 51% in 2024, with 766,285 staff responding.
On enthusiasm for the job, the briefing notes that "This varies by length of service: Staff who have worked at their organisation for less than 1 year and 1-2 years reported relatively higher levels of enthusiasm which are similar to last year, whereas staff who have worked at their organisation for 3 years or longer are less enthusiastic about their jobs and have seen decreases in enthusiasm this year."
This is a useful corrective to a common claim. New starters in that survey are not the disengaged group. They are the most enthusiastic group, and the decline arrives later. If onboarding has a job, it is to carry early enthusiasm into year three rather than to rescue people from an early slump.
The survey does not ask about induction, and it does not report an onboarding score. It reports length of service as a demographic cut, which is still more than most sources manage.
The three onboarding duties that have dates

Onboarding timelines are usually a matter of taste. Three parts are not.
Before employment starts. GOV.UK guidance on checking a job applicant's right to work states that "You must check that a job applicant is allowed to work for you in the UK before you employ them." It also tells employers to "keep copies during the applicant's employment and for 2 years after they stop working for you", and to repeat the check where someone's right to work is time-limited.
On the first day. GOV.UK guidance on the written statement of employment particulars states that "An employer must give employees and workers a document stating the main conditions of employment when they start work", and that the employer must provide "the principal statement on the first day of employment".
Within two months. The same guidance requires "the wider written statement within 2 months of the start of employment", covering pensions, collective agreements, non-compulsory training and disciplinary and grievance procedures.
Probation, by contrast, is entirely yours. Acas guidance states that "A probation period is a time at the start of employment to check if someone is suitable for a job" and that "There's no legal requirement to have a probation period. And they can be any length of time."
On how employers actually use it, the Department for Business and Trade factsheet records that "Many businesses (around 40%) operate discretionary probationary periods, and the vast majority are six months or less."
One change is coming that will put a legal weight on the early months. The same factsheet states that "Section 25 of the Employment Rights Act 2025 will reduce the qualifying period for protection against 'ordinary' unfair dismissal from two years to six months", and that "The Government intends to commence the package of changes relating to unfair dismissal on 1 January 2027." A fair, documented probation process stops being administrative tidiness at that point.
The onboarding statistics worth producing yourself

Every figure below sits in your own records, and none of them needs a benchmark to be worth reading.
- First 90 day leaver rate. Count leavers who joined within the previous 90 days, divided by joiners in the same period. Plot it by month of joining rather than by month of leaving, so a bad cohort shows up as a cohort.
- First year leaver rate. The same sum at 12 months, which aligns with the ONS band boundary and makes your figure legible to anyone reading national data.
- Voluntary against involuntary, inside the first year. A resignation at month four and a failed probation at month four are different problems with different fixes. Reporting them together hides both.
- Onboarding completion by stage. Not one completion percentage, but a figure per stage: paperwork, access and equipment, mandatory training, first goals agreed, first one to one held. The stage where the drop happens is the finding.
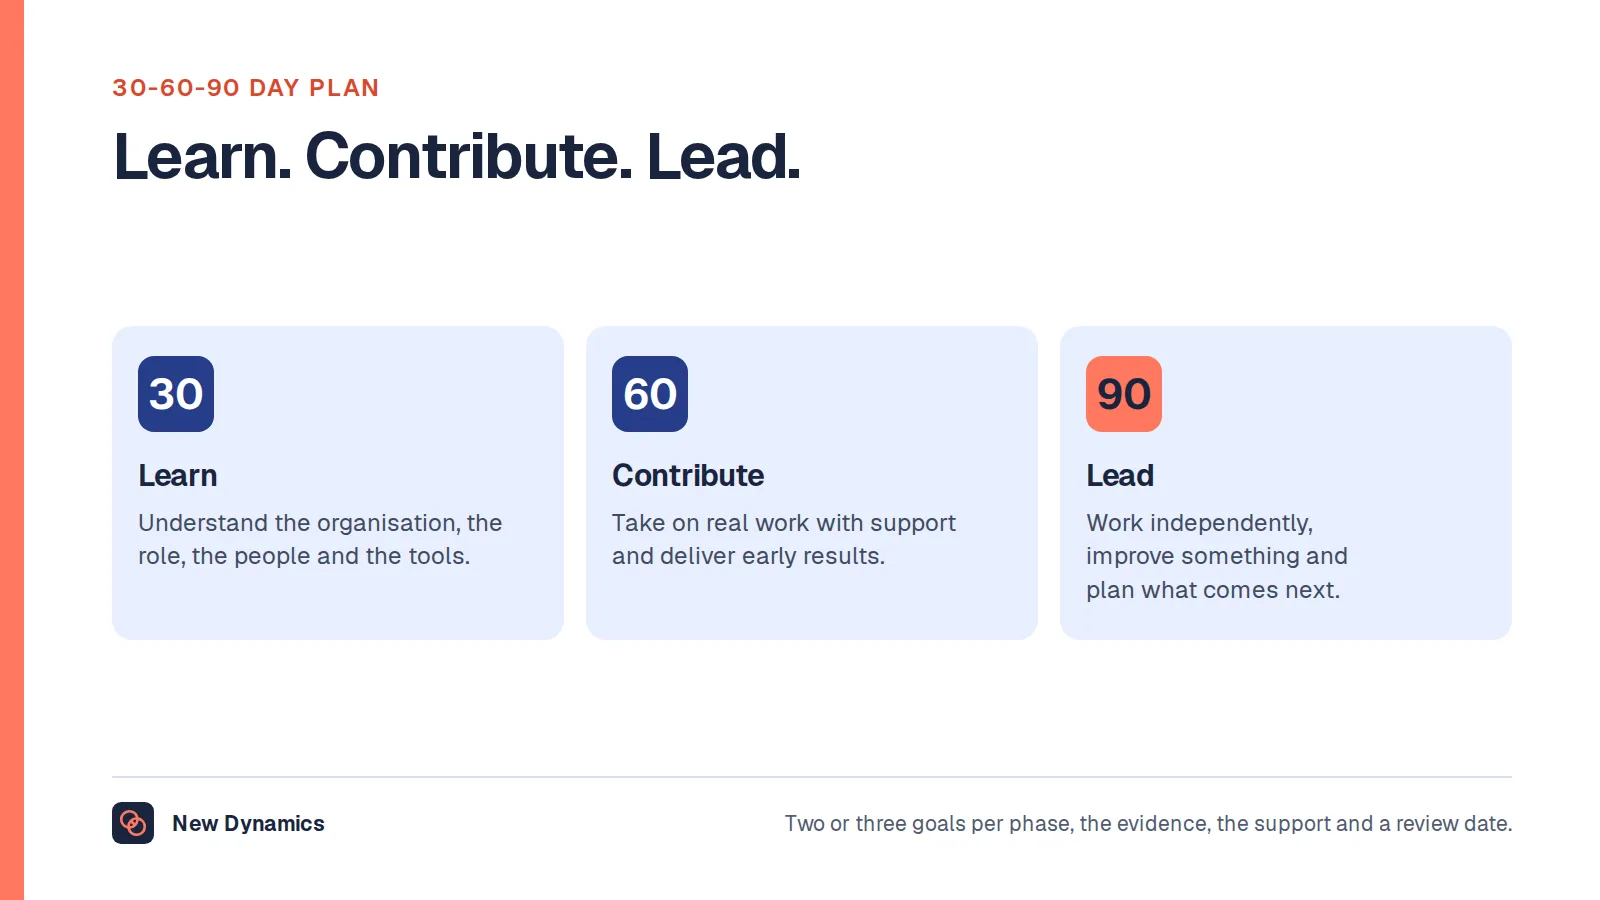
- Time to a first meaningful contribution. Days from start date to the first piece of work the team would have needed doing anyway. Define it per role family, write the definition down, and keep it stable. Our post on the 30-60-90 day plan covers how to set those early milestones.
- Manager actions completed before day one. Whether the equipment, the access and the first week's diary existed before the person arrived. This is the cheapest thing to fix and the most commonly missed, which is also why our post on the welcome email for a new employee exists.
Split each one by location, manager, job family and recruitment source. A first-year leaver rate for the whole organisation is a headline. The same rate for one team with one hiring manager is an action.
What usually goes wrong
- Quoting a vendor onboarding statistic in a business case. If the sample is not published, the number describes a marketing panel.
- Reporting onboarding completion as a single percentage, which hides the stage where people get stuck.
- Counting first-year leavers by leaving month, which smears a bad cohort across a year and hides it.
- Mixing resignations with failed probations, which makes the cause unreadable.
- Treating the legal duties as the onboarding plan. A right to work check and a written statement are the floor, not the experience.
- Changing the definition of a first contribution each year, which ends the trend before it starts.
- Assuming new starters are the unhappy group. The largest survey evidence in the country points the other way.
Frequently asked questions
Are there official onboarding statistics for the UK?
No. No official United Kingdom source publishes an onboarding completion rate, an average onboarding duration or a first-year leaver rate. Those measures describe employer practice, which official statistics do not count. The nearest official evidence is tenure data, which records how long people have been with their current employer.
What do new hire turnover statistics actually show?
The checkable figures are about tenure rather than turnover. A Department for Business and Trade factsheet records around 6.3 million employees, 22% of all employed aged 16 and over, with between six months and two years of service with their current employer. That tells you how many people are in their early years, not how many left.
How long does onboarding take?
There is no published average, because nobody measures it nationally. There are three fixed points in law: the right to work check before employment starts, the principal statement of employment particulars on the first day, and the wider written statement within two months. Everything beyond that is a design choice you should time and record yourself.
What is a good onboarding completion rate?
No official benchmark exists, so the useful question is a different one. Measure completion for each stage separately, then look at the stage where people stop. A high overall completion rate with mandatory training unfinished is worse news than a lower rate that is evenly spread.
Is a probation period a legal requirement?
No. Acas guidance states that there is no legal requirement to have a probation period and that they can be any length of time. The Department for Business and Trade reports that around 40% of businesses operate discretionary probationary periods, and that the vast majority are six months or less.
What must be in place before a new starter's first day?
The right to work check. GOV.UK guidance says employers must check that a job applicant is allowed to work for them in the United Kingdom before employing them, keep copies during employment and for two years afterwards, and repeat the check where someone's right to work is time-limited.
Your next step: count your own first year
- Pull every joiner from the last three years and mark whether they were still employed at 90 days and at 12 months. That gives you the two rates nobody publishes for you.
- Split those leavers into resignations and employer-ended exits, including failed probations.
- Break your onboarding path into stages and report completion per stage, so the stall point is visible.
- Define a first meaningful contribution for each role family, write it down, and start timing it from the next joiner onwards.
For the process these numbers describe, read and download our employee onboarding guide. The guide is free to read, and the PDF uses our short download form.
Want onboarding tasks, early goals and first conversations on one path you can actually measure? Book a New Dynamics demo and bring last year's joiner list. You can also email contact@new-dynamics.com.