TL;DR
- No official statistic gives a UK employee turnover rate. The ONS said in August 2026 that it plans to publish the first experimental labour market flows statistics in late 2026, which tells you they do not exist yet.
- One accredited figure can be quoted today: the Civil Service turnover rate was 6.9% in 2025/26, down from 7.1%, with a resignation rate of 3.1%. It covers one employer group, not the economy.
- Average tenure is published by the ONS only as a dataset on request. The most recent one covers 2006 to 2023. Compare your rate against your own trend and your own definition, not against a number whose method you cannot see.
Somebody asks for the UK employee turnover rate. It sounds like the sort of number that must exist, the way the unemployment rate exists. It does not. What exists is a set of narrower measures, one accredited figure for one employer group, and a large number of survey averages circulating without a visible method.
This article sets out what is published, what each figure actually covers, and what to compare your own rate against instead.
Knowing why people leave is a different job from counting them. See how New Dynamics continuous feedback keeps the reasons visible while the people are still there.
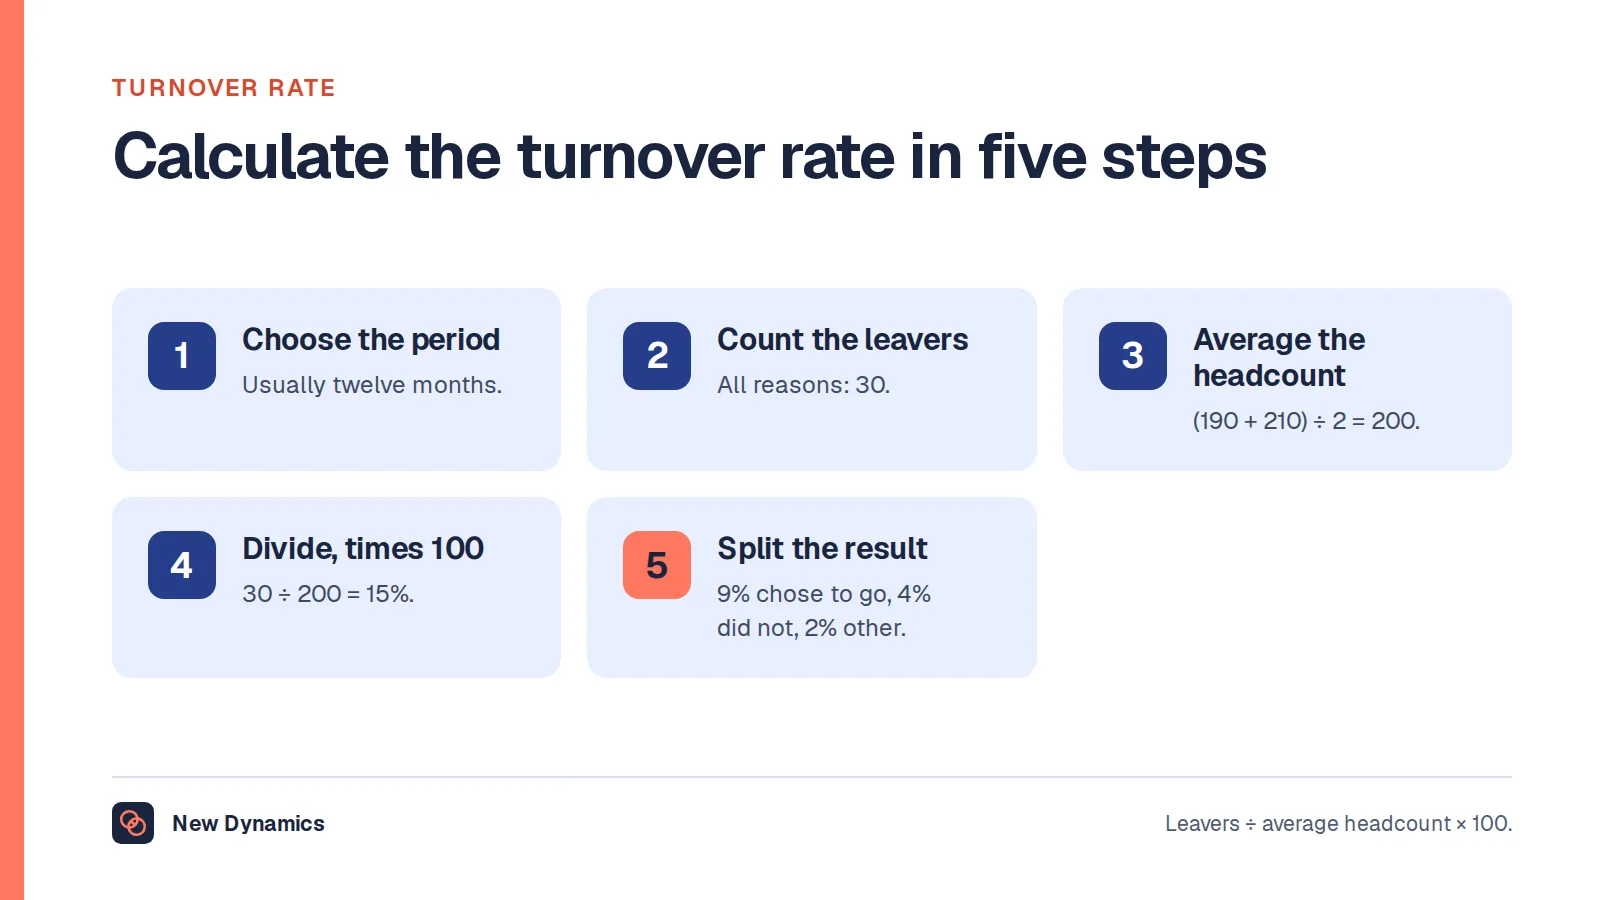
For the formula and the four cuts to apply to it, our post on the turnover rate does the arithmetic.
There is no official UK turnover rate
The clearest evidence for this is the Office for National Statistics saying what it is working on. In its August 2026 update on labour market transformation it states: "We plan to publish the first set of experimental labour market flows statistics in late 2026, which would capture movements in and out of payrolled employment, including job-to-job flows between and within industries."
A statistic that is planned is a statistic that does not exist yet. Until it arrives, there is no national figure for how many people left their employer last year.

The monthly labour market overview covers employment, unemployment, inactivity, vacancies and earnings. None of those is a turnover rate. An employment rate of 75.3% tells you how many people are in work. It says nothing about how often they change employer.
The one rate you can quote
For a specific, large employer group there is an accredited figure. Civil Service Statistics 2026, published on 28 October 2026 and measured as at 31 March 2026, reports: "The turnover rate in the Civil Service fell to 6.9% from 7.1% in 2024/25. The resignation rate fell to 3.1% from 3.6% in 2024/25."
The same bulletin reports that "Over the year, 37,945 people left the Civil Service, down from 38,610 in 2024/25", and that resignation was the most common reason for leaving, accounting for 17,085 leavers.
Two things are worth taking from that, and one thing is worth leaving.
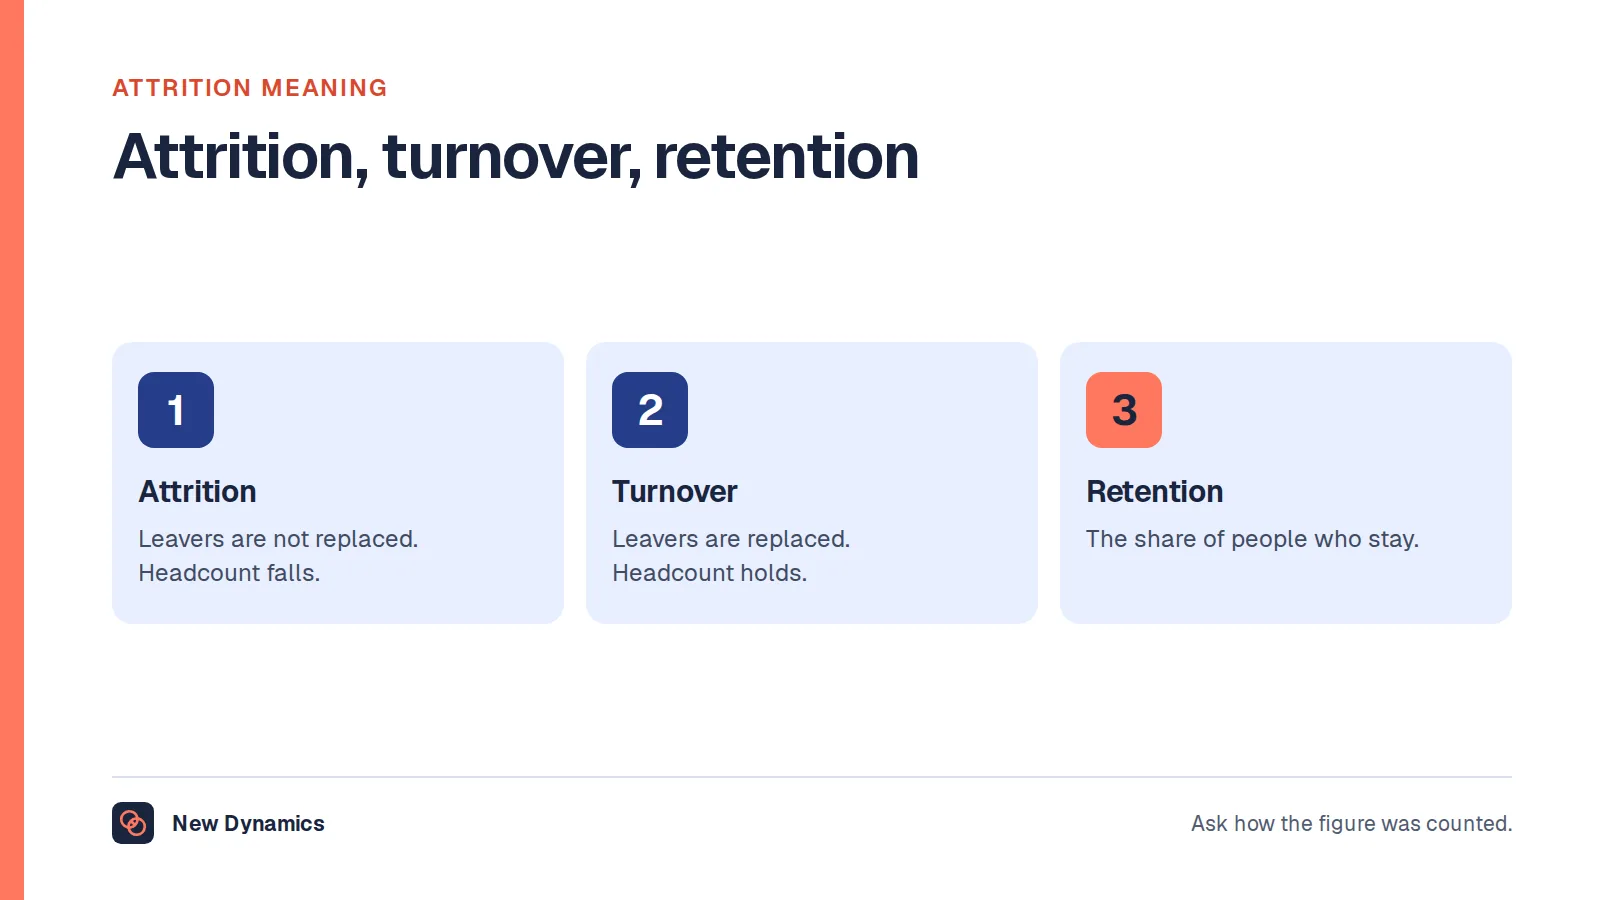
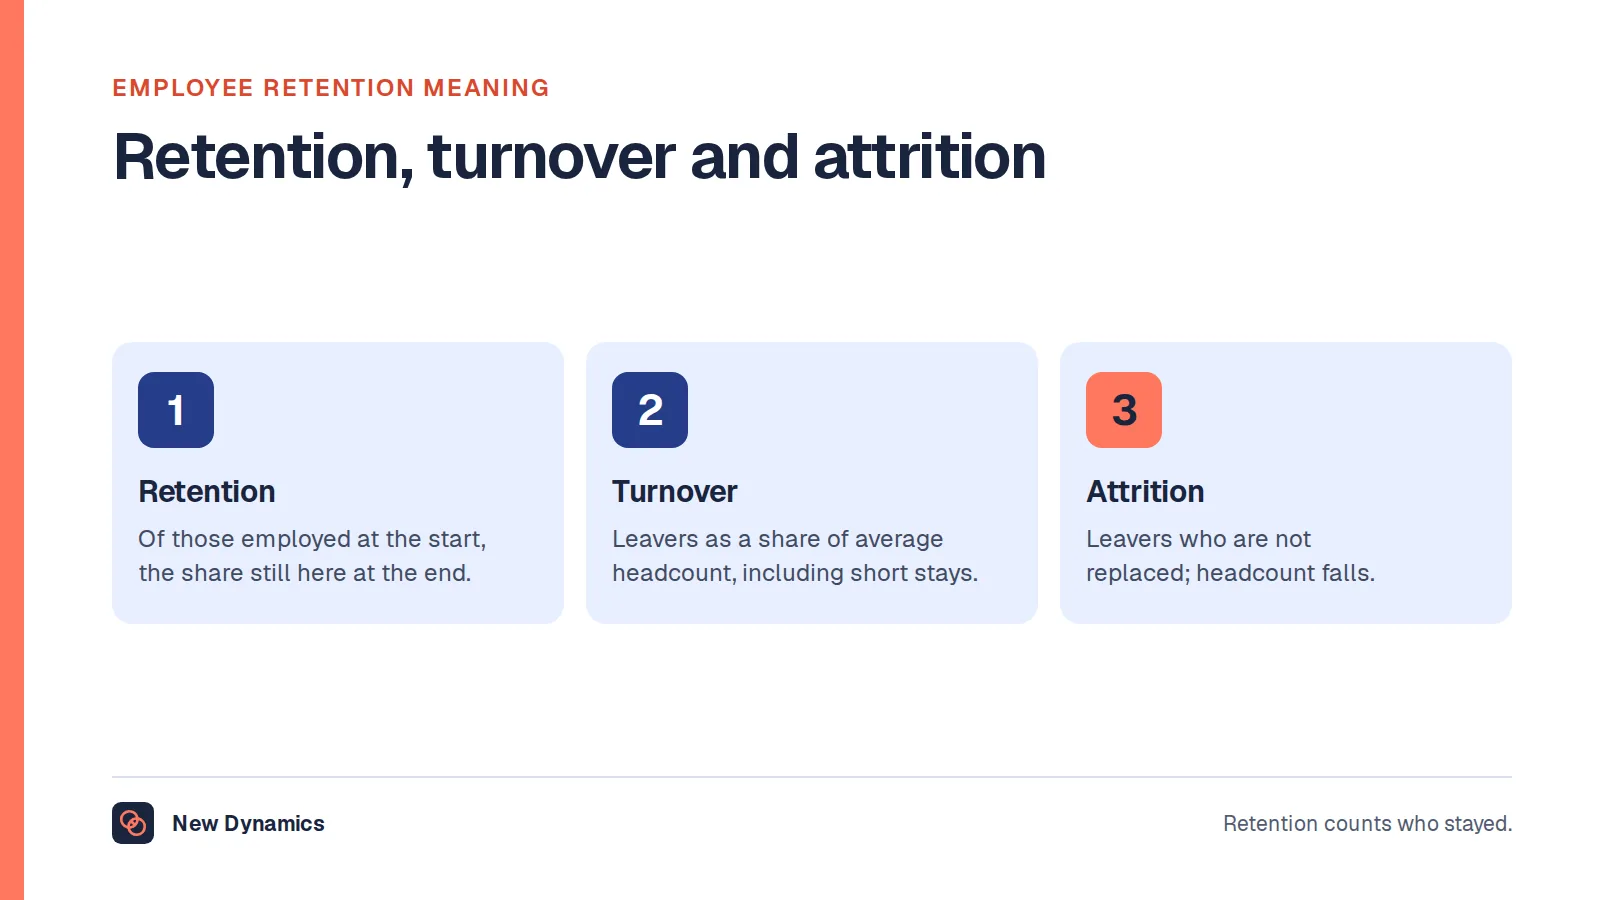
Take the structure. Two rates are published side by side: everybody who left, and the subset who chose to go. That is the single most useful split in the measure, and most organisations do not publish it internally.
Take the direction. A rate reported against the previous year is a trend. A rate reported on its own is trivia.
Leave the number. It describes the Civil Service. It is not a UK rate, it is not a private sector rate, and quoting it as either is the error this article exists to prevent.
Why "average turnover by industry" needs care
Search for turnover by industry and you will find plenty of tables. Before using one, three questions decide whether it means anything.

- Who was asked? A survey of its own members or its own customers describes that panel, not the sector. If the composition is not published, the figure cannot be checked.
- What counted as a leaver? Redundancies, fixed-term endings, transfers between group companies, retirements and the deaths of employees are each included by some definitions and excluded by others. Two organisations with identical experience can report rates several points apart.
- What was the denominator? Average headcount over the period, headcount at the start, or full-time equivalents. These are different sums and they produce different answers.
Where a published figure answers all three, it is usable with its method quoted beside it. Where it answers none, it is a number with a logo on it.
Average employee tenure in the UK
Tenure is not a headline statistic either. The ONS holds it in the Annual Population Survey and publishes it on request. The most recent dataset of this kind, "Employment by duration of employment and age group, UK, 2006 to 2023", was released on 9 May 2024 and gives estimates of employment split by length of time continuously employed with the current employer.
That is the right place to go for tenure. It is also a reminder of how far national data sits from an HR question: the release is a spreadsheet, it is two years old by the time it is quoted, and it answers "how long have people been in their jobs" rather than "how long do people stay with us".
What to compare against instead

Your own trend, on a stable definition. Three years of your own numbers, counted the same way each year, beats any external average. Write the definition down first, including what you do with redundancies, fixed-term endings and internal transfers.
Your own splits. Voluntary against involuntary. First year against everyone else. By department, by manager, by job and by length of service. The cuts are where the cause lives, and our post on the turnover rate sets them out.
Your own cost. Estimate the replacement cost of one real role of your own, with your recruitment fees, your notice periods and your time to competence. A published average cost per leaver is somebody else's arithmetic.
Your own capacity. Can you recruit and train fast enough to replace the people who go? For a seasonal employer a rate that looks alarming may be entirely normal and entirely affordable.
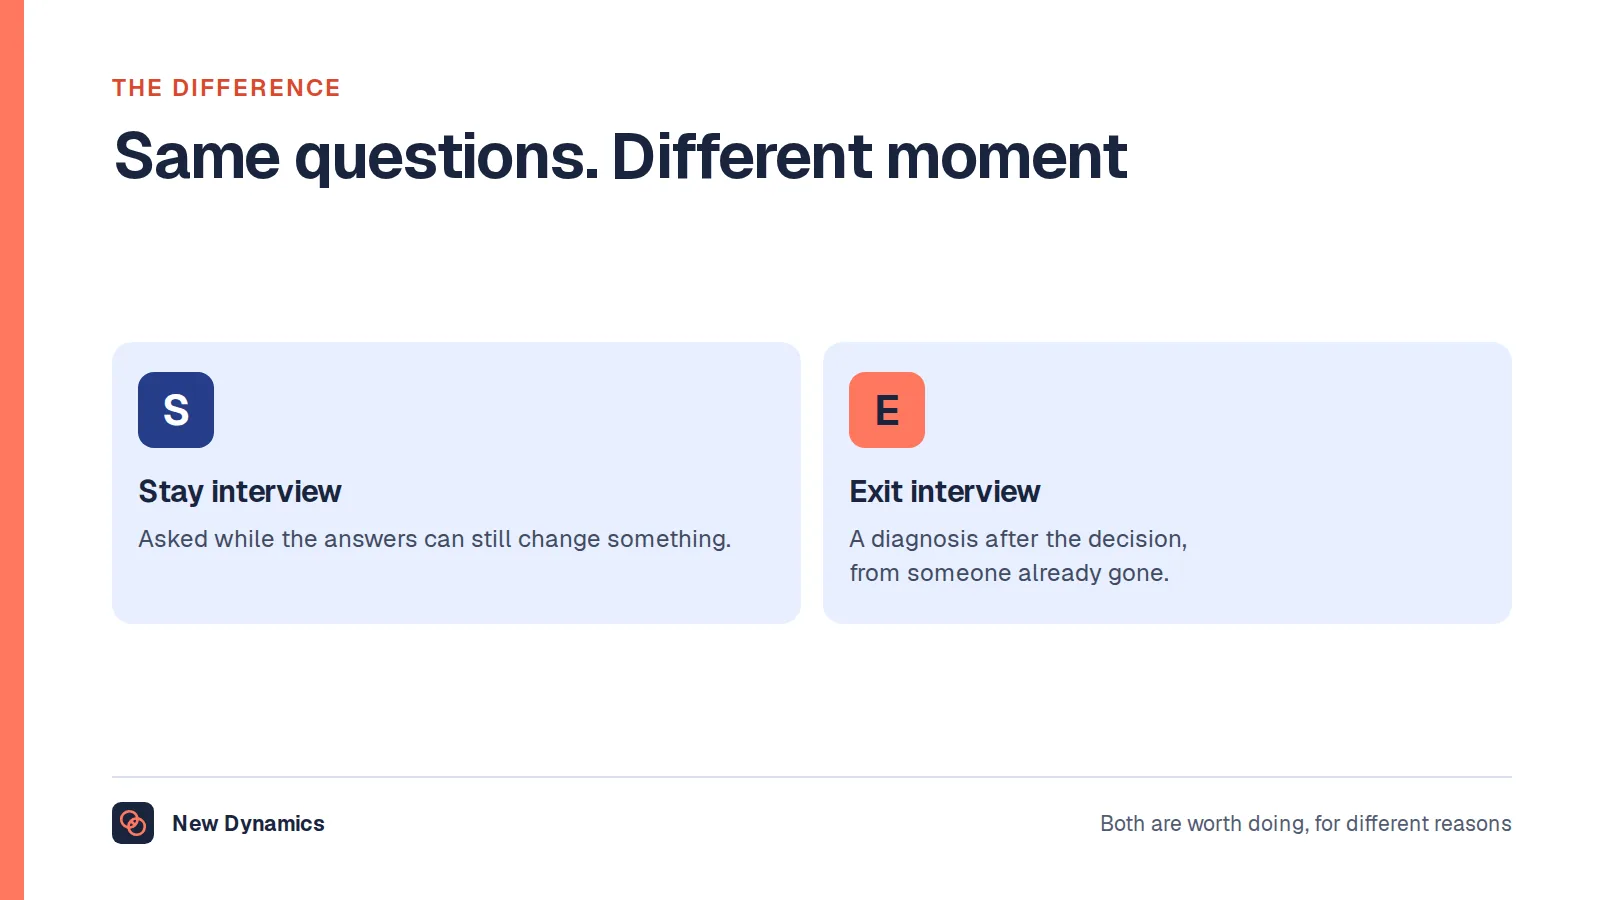
Your own exits and stays. A rate counts people. It does not tell you why. Exit conversations are late evidence, and our post on stay interviews covers the earlier version of the same conversation.
What usually goes wrong
- Quoting a sector average whose method is not published, then defending a budget with it.
- Changing the definition between years, which turns a trend into noise.
- Reporting one overall rate, which hides the voluntary and first-year numbers that would have told you something.
- Treating a public sector rate as a national one, which is the most common misuse of the one accredited figure available.
- Setting a target of zero, which is neither achievable nor desirable.
Frequently asked questions
What is the average employee turnover rate in the UK?
No official statistic publishes one. The ONS said in August 2026 that it plans to publish the first experimental labour market flows statistics in late 2026, which confirms that a national figure for movement between employers is not yet available.
Is there any official UK turnover rate at all?
Yes, for the Civil Service. Civil Service Statistics 2026 reports a turnover rate of 6.9% for 2025/26, down from 7.1%, and a resignation rate of 3.1%, down from 3.6%. Those figures describe the Civil Service as at 31 March 2026 and should not be presented as a UK or private sector rate.
What is the resignation rate in the UK?
There is no national resignation rate. The Civil Service publishes one, at 3.1% for 2025/26. For your own organisation, the resignation rate is voluntary leavers divided by average headcount, which is the figure that most reflects how it feels to work for you.
What is the average employee tenure in the UK?
The ONS holds tenure data in the Annual Population Survey and publishes it as a dataset on request rather than as a headline statistic. The most recent release of that kind covers 2006 to 2023 and was published on 9 May 2024.
Can I use an industry benchmark for turnover?
Only if the publisher states who was surveyed, what counted as a leaver and what the denominator was. Without all three, the figure cannot be compared with yours, because your definition is almost certainly different.
What is a good turnover rate?
There is no universal answer, because rates vary with industry, job, location and year. The useful comparisons are your own trend over several years, your own voluntary and first-year splits, and whether you can replace the people who leave.
Your next step: fix the definition before the number
- Write down what counts as a leaver for you, including redundancies, fixed-term endings and internal transfers.
- Recalculate the last three years on that single definition.
- Split the result into voluntary, involuntary and first-year turnover.
- Pick one department with a rate you cannot explain, and go and ask the people still there.
For the conversations that surface a resignation before it is written, read and download our employee engagement guide. The guide is free to read, and the PDF uses our short download form.
Want the reasons people leave visible while they are still here? Book a New Dynamics demo and bring last year's leaver list. You can also email contact@new-dynamics.com.