TL;DR
- A review cycle produces five numbers worth reporting: completion with its definition attached, rating distribution by manager, evidence density from a sample, lateness and chasing effort, and movement against last year.
- Three numbers mislead. An average rating is not a performance score, manager league tables measure scale use rather than team quality, and cross-team comparisons compare different work.
- This is reporting on identifiable people, so the data protection rules apply: aggregate rather than name, restrict access to those who need it, keep it accurate, and remember that anybody can ask to see what is held about them.
Somebody asks HR for a performance dashboard. What arrives is usually an average rating by department, a completion percentage with no definition, and a chart comparing teams that do entirely different work. It is read once, questioned twice, and quietly ignored after that.
This article covers what a review cycle actually produces, the five numbers worth reporting, the three that mislead, the rules that apply because this is data about identifiable people, and the three questions a board actually needs answered. It describes the position in the UK and Great Britain and is general information, not legal advice.
Reporting is easier when the cycle produces structured data rather than a folder of documents. See how New Dynamics performance reviews keep goals, evidence and outcomes in one place.
What the cycle produces
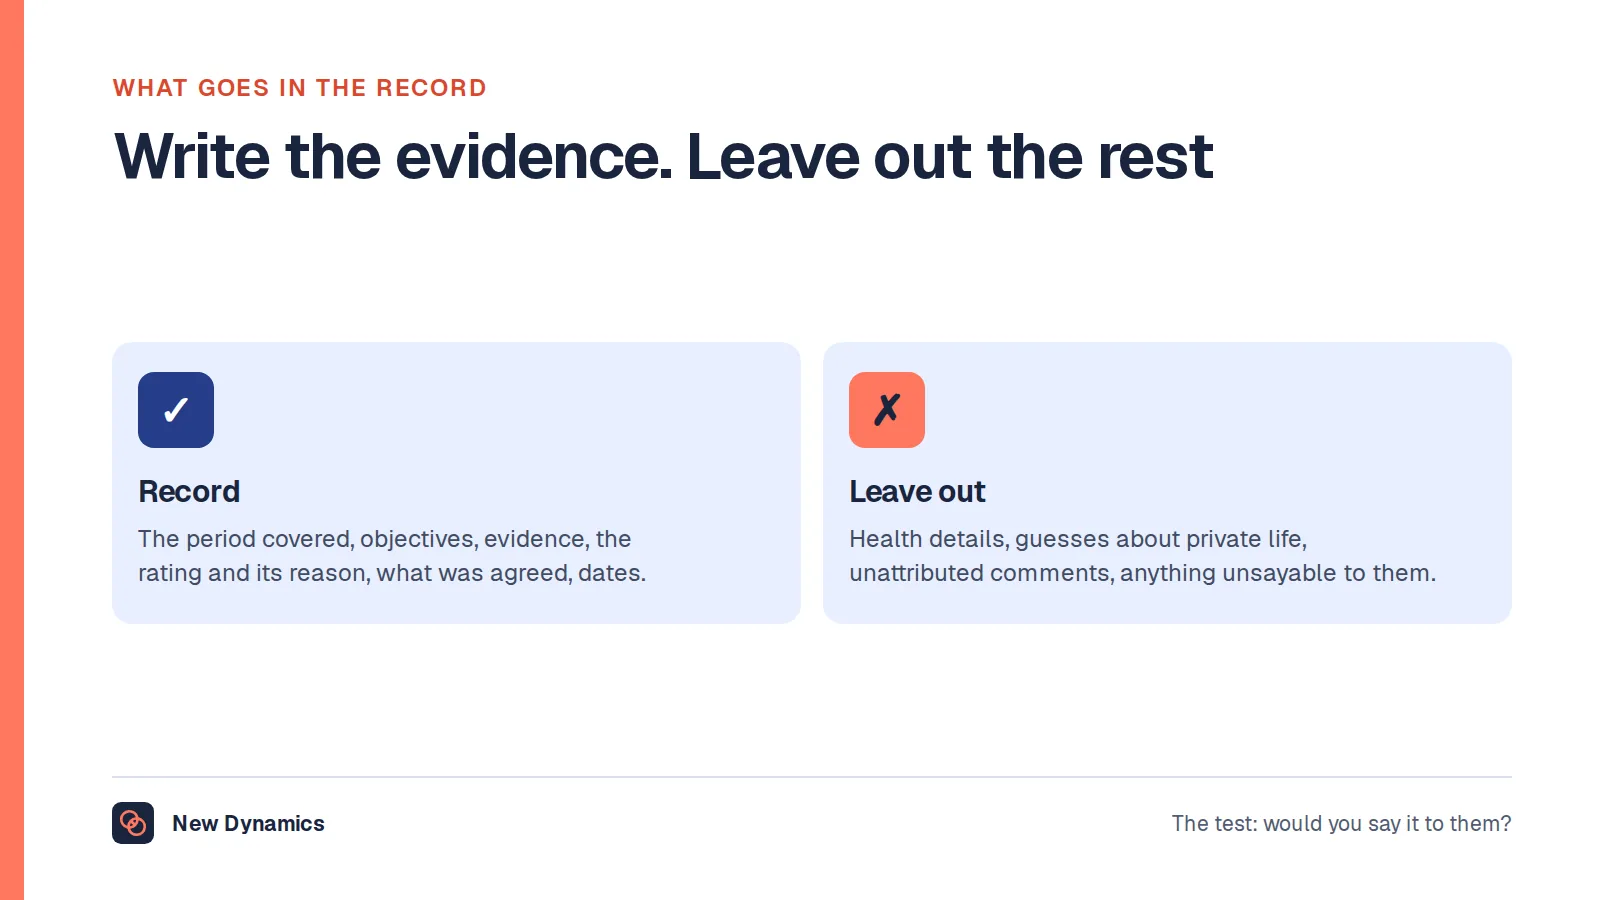
Before deciding what to report, list what exists: who was due a review and who had one, when each was completed, the rating or outcome, the objectives and their status, the written evidence, who the manager was, and whether anything was contested. Acas describes reviews as based on things like whether someone is "meeting or has met any agreed objectives" and "demonstrating the right behaviours in their work", and says a written record should be kept and shared.
Most of that is useful operationally and only some of it belongs in a report.
Five numbers worth reporting

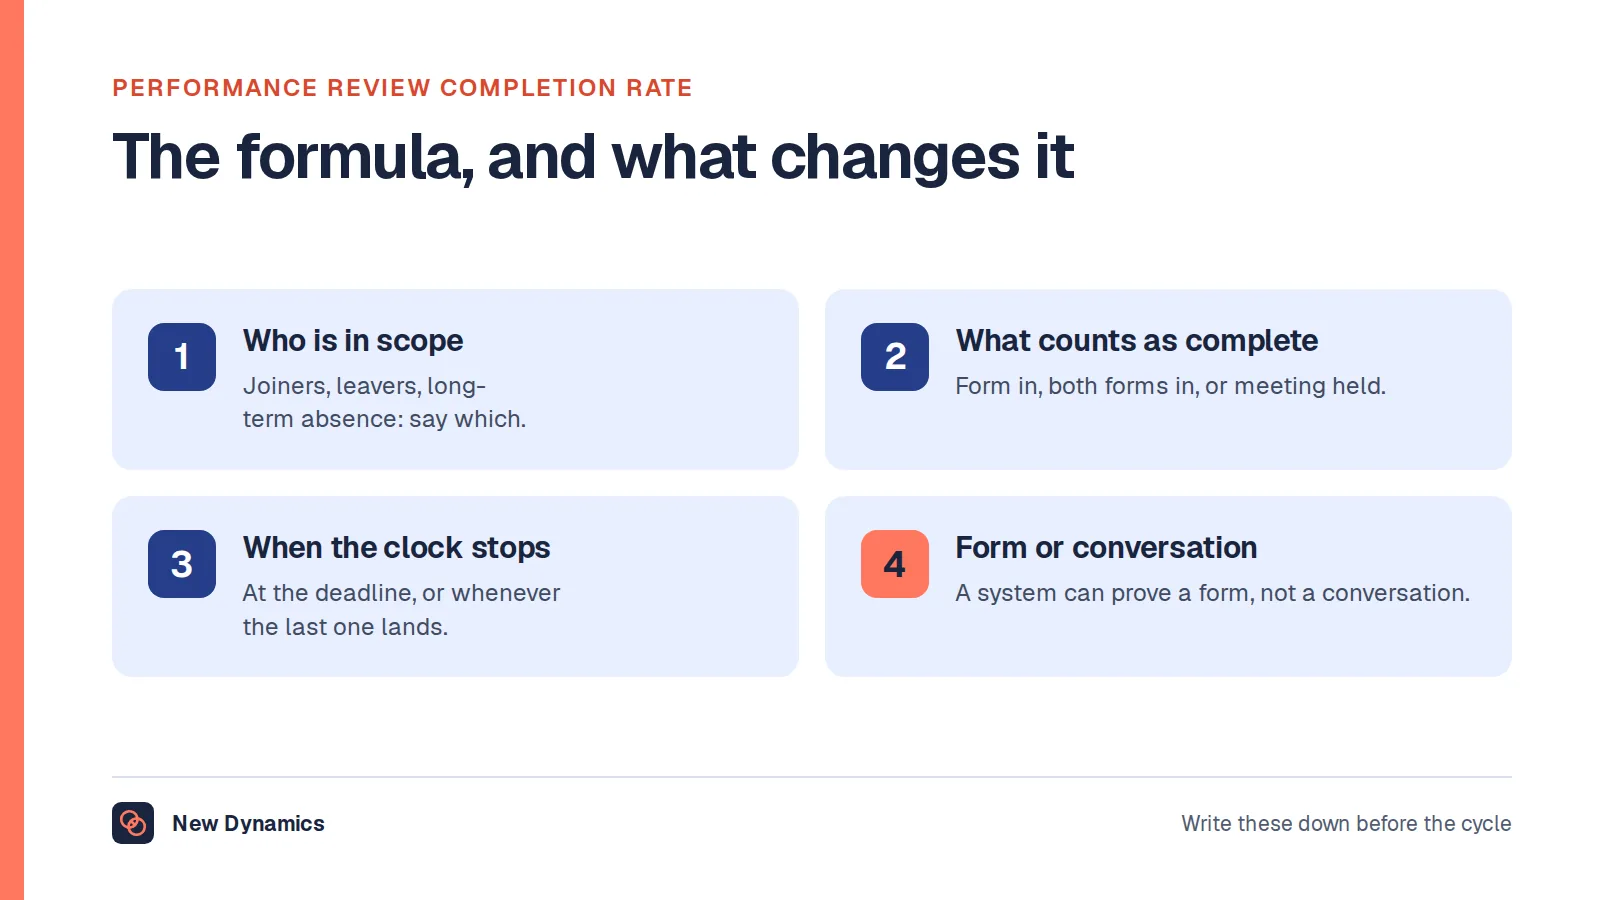
1. Completion, with the definition attached. The first number anybody asks for, and the one most often quoted without saying what counts as complete or who was in the denominator. Our post on the performance review completion rate covers the four decisions that change the answer.
2. Rating distribution by manager and by team. Not to rank managers, but to see whether the scale is being used. A manager using one point of five is a finding worth a conversation, as our post on rating an employee fairly sets out.
3. Evidence density, from a sample. Take ten or twenty reviews at random and count the specific, verifiable examples. It is the only measure of quality rather than compliance, and it moves when training works.
4. Lateness and chasing effort. How many were late, and roughly how much HR time went into reminders. This is the number that justifies fixing the process rather than nagging the managers.
5. Movement against last year. How many people's ratings changed at all. If almost nobody moved, last year's number is doing the work rather than this year's evidence.
Report trends rather than single points, and put the denominator next to every percentage.
Three numbers that mislead

The average rating. Presented as a performance score for a department, it is nothing of the kind: it measures how that department's managers use the scale. Two teams with identical work can differ by half a point because one manager read the definitions.
Manager league tables. Ranking managers by their team's average rating rewards generosity and punishes honesty, and within two cycles the generous managers look like the best.
Cross-team comparisons of different work. A support team and a research team cannot be compared on rating distribution any more than on output. Compare each with itself over time instead.
If leadership asks for one of these, offer the alternative rather than refusing flatly: distribution with definitions, trend within team, and the evidence-density sample.
The rules that apply to people data

This is reporting on identifiable individuals, even when the output looks like a chart.
- Aggregate, and suppress small numbers. A distribution for a team of four identifies people. The ICO's data minimisation principle requires what you hold to be "adequate, relevant, and limited to what you need for your purposes".
- Restrict access. The ICO expects employment records to be accessible only to those authorised, with "managers only have access to the information they need to meet their obligations". A dashboard circulated widely is a disclosure decision, not a formatting one.
- Keep it accurate. The accuracy principle requires reasonable steps to keep personal information accurate and up to date, which includes not reporting stale extracts as current.
- Expect to be read. Anybody can ask for a copy of the personal information held about them, answered "without delay and within one month". Our post on performance review record keeping covers the retention and access side in full.
Fairness analysis, done properly
Once a year, with HR and in aggregate, look at outcomes by working pattern, location, periods of leave and, where the data allows and the governance is in place, by protected characteristic.
Acas notes that less favourable treatment "might include: excluding someone from opportunities or benefits" and that it "can still be discrimination even if the less favourable treatment was not intended". Ratings decide opportunities. Looking at the pattern is how an organisation finds out before somebody else does, and not looking is a choice with its own risks.
Two cautions: small groups identify individuals, so suppress them, and a difference is a question rather than a conclusion. The next step after a pattern is to read the evidence behind the reviews, not to adjust anyone's rating.
What a board actually needs
Three questions, answered in a page.
- Are reviews happening? Completion with its definition, and lateness.
- Are they consistent? Distribution by manager, movement against last year, and the evidence sample.
- What did we learn? Two or three themes from the cycle and what is changing because of them.
Anything beyond that is for the HR team's own use. Our post on HR metrics covers why most people numbers cannot be compared between organisations, which is worth saying out loud before anybody asks for a benchmark.
Cadence and ownership
Report the operational numbers while the cycle is running, because they can still change something: completion and lateness weekly during the window, distribution once drafts exist and before calibration. Report quality and fairness afterwards, when there is something settled to analyse.
One person should own the definitions. The commonest failure in people reporting is not a wrong number but two teams quoting the same metric calculated differently, which ends every discussion in arithmetic rather than in decisions.
Five questions to ask about any people number
Useful whether you are producing the report or receiving it.
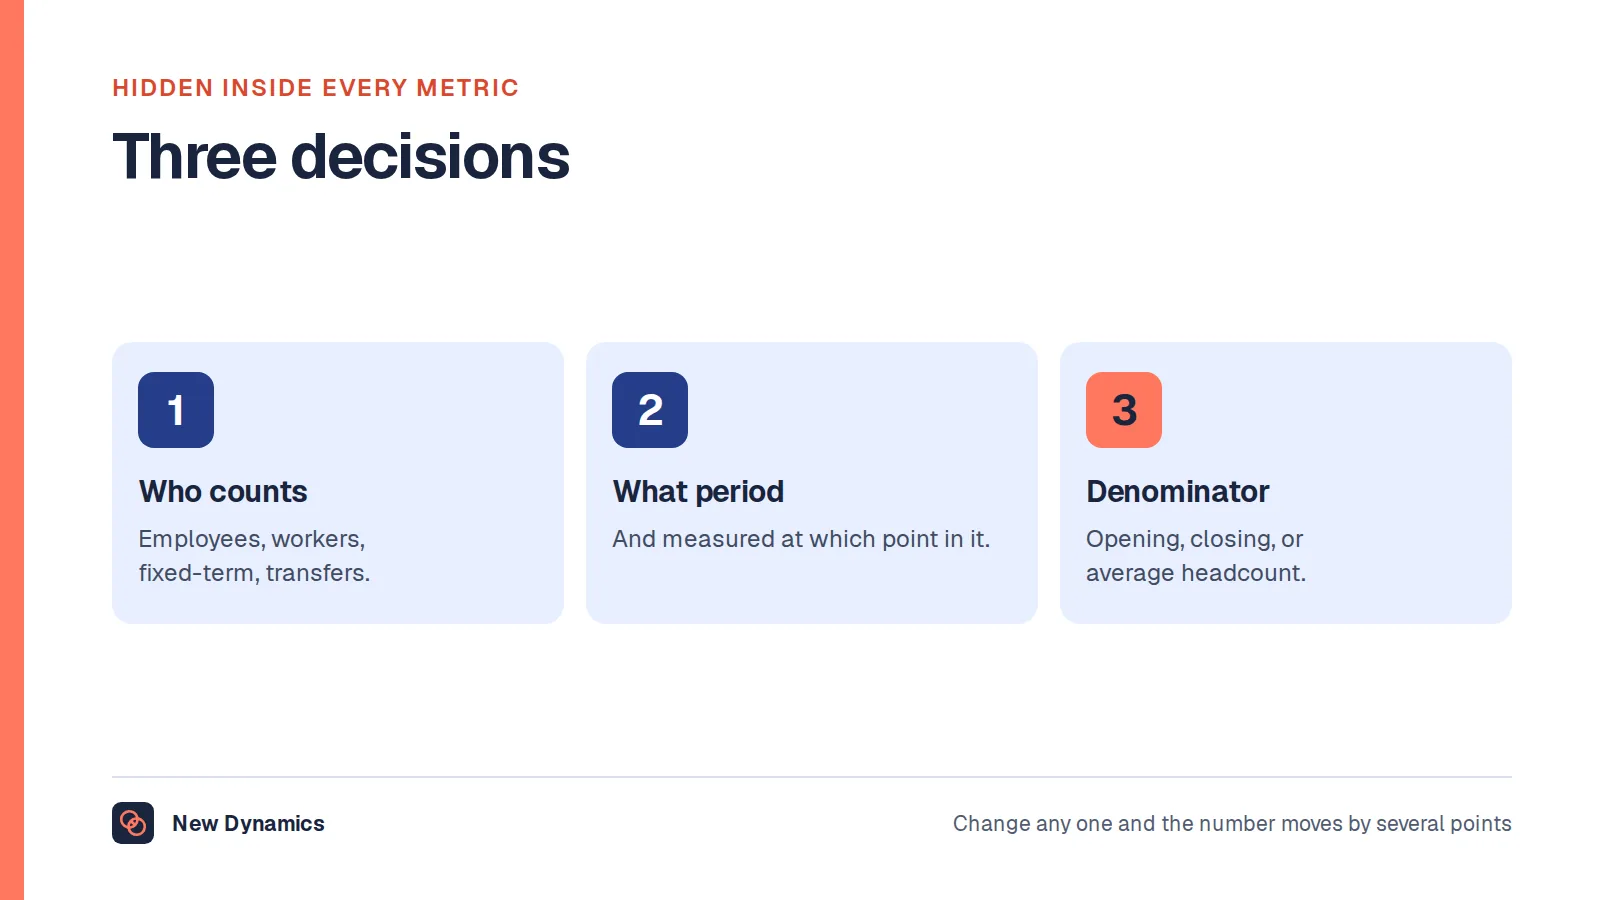
- What is the denominator? Everyone employed, everyone due a review, or everyone whose manager remembered?
- When was it measured? A completion figure on the deadline and one a fortnight later are different numbers.
- What counts as complete, or as a rating? A draft saved, a meeting held, a form signed.
- How big is the group? Small groups identify individuals and should not be shown.
- Compared with what? Last year, the same team last quarter, or another team doing different work, which is the one to refuse.
Frequently asked questions
What performance data should HR report?
Five things: completion with the definition stated, rating distribution by manager and team, evidence density from a sample of reviews, lateness and chasing effort, and how many ratings moved against last year. Report trends rather than single points and show the denominator with every percentage.
Is average rating a useful metric?
Not as a performance score. It measures how managers in that group use the scale, which is worth knowing for a different reason. Two teams doing identical work can differ because one manager read the rating definitions and another did not.
Should you rank managers by their team's ratings?
No. League tables reward generosity and punish honest rating, and within a couple of cycles the most generous managers look like the strongest. Use distribution to start a conversation about scale use instead.
What are the data protection rules for performance reporting?
Aggregate rather than name, suppress small groups that identify individuals, restrict access to those who need it, keep the data accurate rather than reporting stale extracts, and remember that anyone can request the personal information held about them and must be answered within a month.
How do you check performance ratings for bias?
Once a year, in aggregate and with HR, compare outcomes by working pattern, location, periods of leave and, where data and governance allow, by protected characteristic. Suppress small groups. Treat any difference as a question that sends you to the evidence behind the reviews, not as a reason to adjust ratings.
What should a performance report tell the board?
Whether reviews are happening, whether they are consistent, and what the organisation learned. One page, three answers, with definitions attached. A longer dashboard is usually for the HR team rather than the board.
Your next step: fix the first number
- Write down your completion definition, including who is in the denominator, and put it next to the number.
- Chart rating distribution by manager, with names hidden for the first conversation.
- Sample ten reviews and count the specific examples in each.
- Check your dashboard's access list, and suppress any group small enough to identify a person.
For the policy and governance this sits inside, read and download our employee data protection guide. The guide is free to read, and the PDF uses our short download form.
Want a cycle that produces reportable data rather than a folder of documents? Book a New Dynamics demo and bring last cycle's report. You can also email contact@new-dynamics.com.