TL;DR
- The demand side is well measured. ONS early estimates for July to September 2026 suggest a decrease of 21,000 (2.9%) vacancies to 691,000, the first time the total has been below 700,000 since February to April 2021, with 2.4 unemployed people per vacancy in June to August 2026.
- Hard to fill vacancies have one official UK measure. The Employer Skills Survey 2024 records 345,300 hard-to-fill vacancies and 37% of all current vacancies described by employers as hard to fill, against 57% in 2022.
- No official UK statistic exists for time to hire, cost per hire, offer acceptance rate or interview to hire ratio. Circulating averages come from vendor and membership panels with undisclosed composition, so measure all four inside your own process on a written definition.
Somebody asks for the UK recruitment statistics. Part of the answer is published every month, measured carefully and free to read. The rest of it, including almost every figure a hiring team is actually judged on, has no official UK source at all.
This article separates the two. It gives the published numbers with their publisher and reference period attached, and it says plainly where no official statistic exists, with how to produce each missing measure inside your own process instead.
The recruitment numbers stop where the retention numbers start. See how New Dynamics onboarding carries a new joiner from accepted offer to first review without the handover getting lost.
For the process behind these figures, our post on recruitment process evaluation sets out how to review each stage.
What the UK publishes about recruitment
Two monthly releases from the Office for National Statistics carry nearly all of the official picture, and both are about demand for workers rather than about how any employer hires.
The first is the vacancies series. In its bulletin released on 20 October 2026, the ONS reports that "Vacancy estimates decreased on the quarter, with early estimates for July to September 2026 suggesting a decrease of 21,000 (2.9%) vacancies to 691,000, compared with April to June 2026; this is the first time the total has been below 700,000 since February to April 2021".
The second is the wider labour market. The ONS Labour market overview released the same day reports that "The UK unemployment rate for people aged 16 years and over was estimated at 4.7% in June to August 2026", with an employment rate for people aged 16 to 64 years of 75.3% for the same period.

Those are the figures to quote when somebody asks how hard the market is. They describe the whole economy for a named three-month period, they are revised openly, and they cost nothing. What they do not describe is your pipeline. No official release counts applications, interviews, offers or days.
For the wider set of published work and workforce figures with their periods attached, our HR statistics hub collects them in one place.
Vacancies by industry and the ratio worth watching
The vacancies bulletin is more useful than its headline. It breaks the total down, and the breakdown is where a hiring plan actually lives.
On industry, the ONS reports that "Vacancy estimates decreased in 14 of the 18 industry sectors, compared with April to June 2026; the largest industry decrease was in construction (down 7,000 vacancies)". On employer size, it reports that estimates "decreased in 4 of the 5 employment size bands, compared with April to June 2026; the largest decrease was for businesses with 1 to 9 employees (down 21,000 vacancies)".
The single most practical figure in the release is the ratio. The same bulletin states: "There were 2.4 unemployed people per vacancy in June to August 2026, down from 2.5 in March to May 2026, a level at which the ratio has remained since July to September 2025."
A vacancy count on its own tells you about demand. The ratio tells you about competition, because it sets demand against the people looking. The bulletin also gives a rate, reporting that "The UK vacancy rate (the proportion of unfilled jobs to total jobs in the economy) was 2.1% in July to September 2026, down 0.1 percentage points since April to June 2026".
Use the national ratio as context and never as a forecast for one role. A ratio of 2.4 unemployed people per vacancy across the economy says nothing about how many qualified theatre nurses or gas engineers are available in your travel-to-work area. For what the word itself covers in official counts, our post on vacancy meaning sets out the definition.
Hard to fill vacancies: the one official UK measure
This is the keyword where an official answer does exist, and it is better than most people expect. The Employer Skills Survey is an official statistic covering the whole United Kingdom. The 2024 survey was conducted by telephone with 22,712 employers, with fieldwork running "from 24th June 2024 to 31st January 2025", and it asks employers directly about vacancies they are struggling to fill.
Its headline on volume: "There was a total of 345,300 hard-to-fill vacancies in 2024, a large decrease from the 2022 figure of 850,000, but similar to the figure in 2017 (336,800)."
On how many employers were affected: "In 2024, 8% of employers had at least one hard-to-fill vacancy at the time of the survey, far fewer than found in 2022 (15%), though unchanged from 2015 and 2017."
And on the share of vacancies, which is the figure to compare your own difficulty against: "Overall, approaching two fifths (37%) of current vacancies were described by employers as hard to fill (hard-to-fill vacancy density). This was much lower than in 2022 (57%), though higher than in 2017 (33%)."
Three further cuts from the same report are worth having to hand.
By sector. The report states that hard-to-fill density "was highest in Construction (57%) and was above average in Education (46%), Manufacturing (44%), Arts and Other Services (43%) and Primary Sector and Utilities (43%). In contrast, in Public Administration just 12% of vacancies were proving hard-to-fill."
By cause. The report finds that "Just over half of hard-to-fill vacancies (53%) were felt to be difficult to fill because of issues related to the quality of applicants", while contextual issues were a factor behind 44%, most often poor terms and conditions including pay for the role at 22%. Read those two together before concluding that the labour market is at fault.
By skills. Where applicants lacked the skills, qualifications or experience required, the vacancy is counted separately as a skill-shortage vacancy. The report records 250,500 of them in 2024, 27% of all vacancies, and notes that employers "were most likely to have experienced skills-related difficulties when recruiting for Skilled Trades positions (48% of all vacancies in this occupation were SSVs)".
One caveat belongs with all of it. The survey is taken at sites, at a point in time, and the 2024 wave used a much smaller sample than 2022, so read the sector splits as indicative rather than precise. The fieldwork also ended in January 2025, which makes this a structural picture rather than a current one.
The ONS Business Insights and Conditions Survey is the quicker read on the same question. In its bulletin released on 5 March 2026, drawing on wave 151 of the survey, the ONS reports that "One in five (20%) businesses with 10 or more employees reported experiencing recruitment difficulties in January 2026, down 9 percentage points from October 2025". Of those businesses, 47% cited a lack of qualified applicants for the roles on offer and 29% cited a low number of applications. The same bulletin adds that "In February 2026, 17% of businesses with 10 or more employees reported they had been affected by worker shortages; this proportion has been broadly stable since November 2024."
Average time to hire in the UK: no official figure exists
There is no official UK statistic for time to hire. No ONS release, no government department and no accredited series publishes one, for the economy, for a sector or for a job family.
Every average you will find comes from somewhere else. Applicant tracking vendors report the median across their own customer base. Membership bodies report what their responding members told them. Job boards report what passed through their own platform. Three problems follow, and they compound.
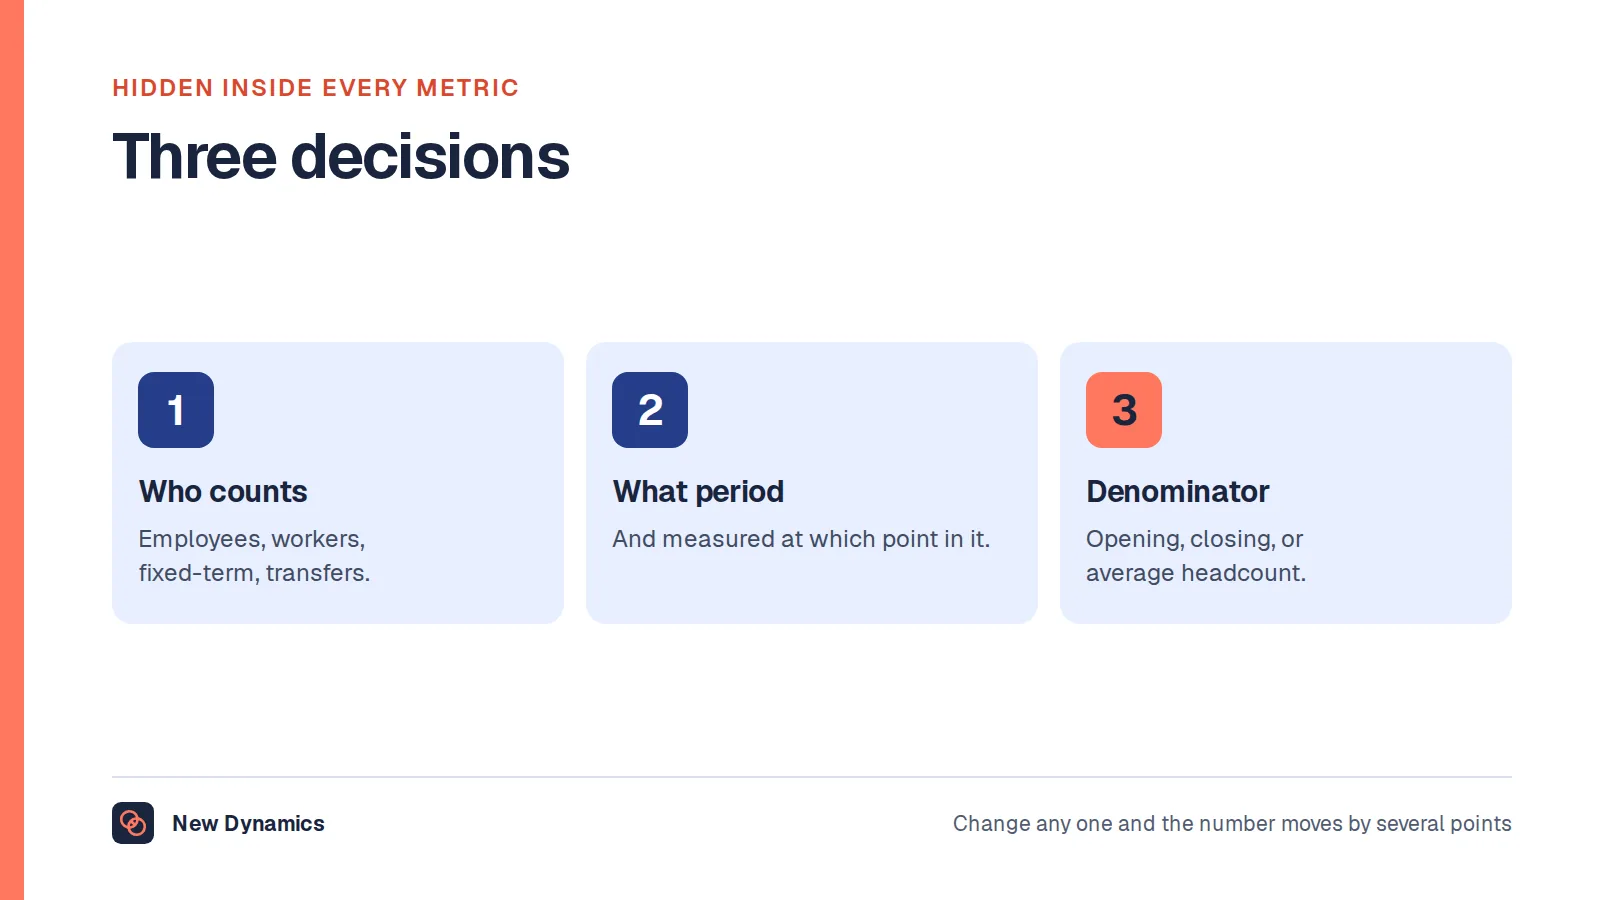
First, the panel is self-selecting and usually undisclosed, so the figure describes whoever answered. Second, the definition moves. One publisher starts the clock when a requisition is approved, another when the advert goes live, another at first application. Third, the ending moves too. Some stop at verbal offer, some at signed contract, some at the first day worked, which can be two or three months later in a notice-period economy.

So measure it yourself, and write the definition down before you measure anything.
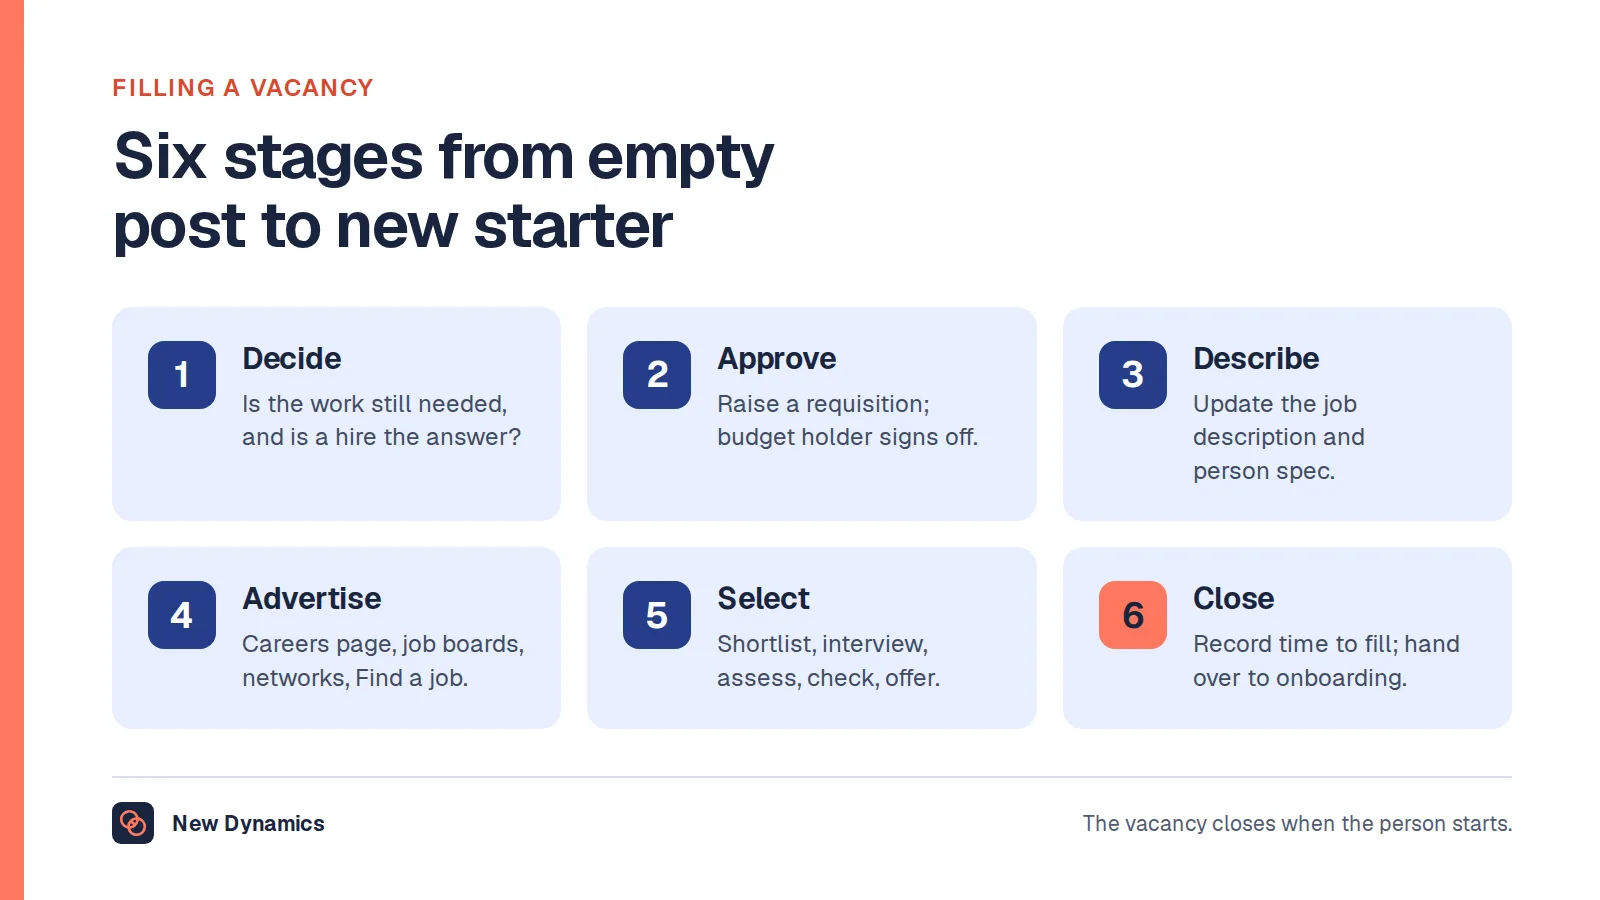
Where the clock starts. Use the date the vacancy was approved to recruit, not the date the advert went live. The approval date includes the internal delay, which is the part you control and the part an external benchmark hides.
Where the clock stops. Use the date the candidate accepted in writing. Stopping at start date measures notice periods, which belong to the candidate's current employer and not to your process.
What to report. Report the median, not the mean, because one withdrawn senior search will drag a mean of twenty hires by weeks. Report it by job family and by hiring manager. Then split the total into stage times: approval to live, live to shortlist, shortlist to first interview, final interview to offer, offer to acceptance. The total tells you whether you have a problem. The stage times tell you where it is.
Keep a second clock alongside it for time to productivity, which is the only one the business feels. Our post on HR metrics covers how to keep a small set of measures honest over several years.
Cost per hire in the UK: no official figure exists
Nor is there an official UK cost per hire. The same vendor and membership panels circulate averages, with the same undisclosed composition, and with a wider definitional problem, because cost per hire can legitimately mean almost anything.
Build your own, and be explicit about the boundary.
External costs. Agency and search fees, job board and advertising spend, assessment and testing licences, background screening, referral bonuses actually paid, and candidate travel or expenses reimbursed.
Internal costs. Recruiter and coordinator time, hiring manager and interviewer time at a loaded hourly rate, and any share of recruitment technology you choose to allocate. Say in the definition whether you include internal time at all. A number that excludes it is not wrong, but it is not comparable with one that includes it.
The denominator. Hires that started in the period, or offers accepted in the period. Pick one. Decide what you do with internal moves, rehires, fixed-term conversions and hires who withdrew after acceptance.
The split that earns its keep. Agency against direct. The whole value of a cost per hire is in showing what each channel costs you, so that a sourcing decision has a number behind it rather than a habit.
Then publish the formula with the figure, every time. A cost per hire without its boundary is not a measure, it is a rumour with a currency symbol.
Offer acceptance rate and interview to hire ratio
Neither of these has an official UK source either. Both are worth measuring anyway, because both are cheap to produce and both move when you change something.
Offer acceptance rate. Offers accepted divided by offers made, in a stated period. Three decisions make or break it. Count formal offers only, or you will flatter yourself by excluding the verbal ones that were turned down. Count a withdrawn acceptance as a decline, with the reason recorded. Record every decline reason in a short fixed list, with pay, competing offer, counter offer from current employer, role content, location or working pattern, and speed of process as the options. Any published benchmark in the nineties almost certainly counts only formal written offers made after a salary conversation, which is a different measure from yours.
Interview to hire ratio. The number of candidates interviewed for each hire made. State which interviews count. A ratio built on first-stage screens is a different number from one built on panel interviews, and the two are routinely quoted side by side as though they were the same thing.

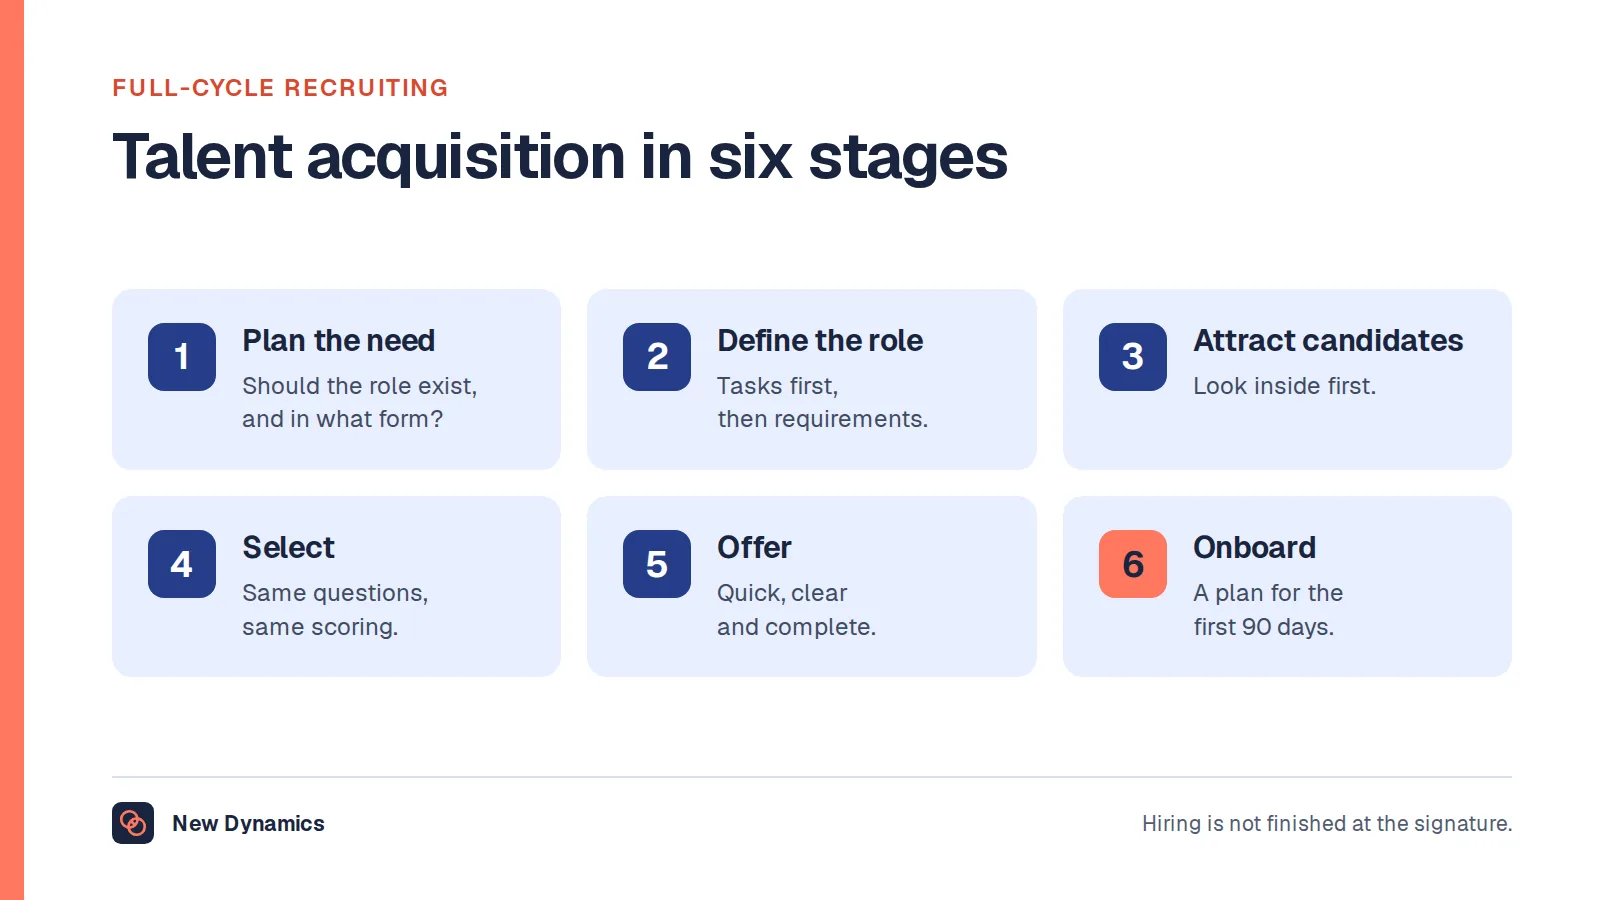
The ratio is most useful read with the rest of the funnel rather than alone. Applications per vacancy, screen to interview, interview to offer, offer to acceptance. A rising interview to hire ratio with a steady offer acceptance rate points at the shortlist. A good ratio with a falling acceptance rate points at pay, at speed, or at what candidates meet when they get to the final stage. Our post on talent acquisition covers the wider process these ratios describe.
Both measures need a stable definition and at least a year of your own history. Without that, a quarterly movement is noise.
What usually goes wrong with recruitment benchmarks
- Quoting a vendor average as a national statistic, when no national statistic exists for the measure.
- Comparing a time to hire with somebody whose clock starts elsewhere, which is most comparisons.
- Changing the definition between years, which ends the only trend you had.
- Using the national vacancy ratio for one hard role, when the ratio describes the whole economy.
- Reporting a mean time to hire, which a single long search distorts.
- Reporting cost per hire without its boundary, so nobody can tell what is inside it.
- Treating hard-to-fill density as fixed, when the official series shows it moving from 33% to 57% and back to 37% across three waves.
Frequently asked questions
How many job vacancies are there in the UK?
ONS early estimates for July to September 2026 suggest a decrease of 21,000 (2.9%) vacancies to 691,000, compared with April to June 2026. The ONS notes this is the first time the total has been below 700,000 since February to April 2021. The estimate is revised as more data arrives, so quote it with its three-month reference period attached.
What is the average time to hire in the UK?
No official UK statistic publishes one. Figures in circulation come from applicant tracking vendors, job boards and membership surveys whose panel composition is usually undisclosed, and whose clocks start and stop in different places. Measure your own from vacancy approval to written acceptance, report the median rather than the mean, and split it by stage.
What is the average cost per hire in the UK?
There is no official UK figure. Build your own and publish the boundary with it: external spend such as agency fees, advertising, assessment and screening, whether internal recruiter and interviewer time is included, and whether the denominator is hires started or offers accepted in the period. Report it split by agency and direct channels.
What is a good offer acceptance rate?
No official benchmark exists, so the useful comparison is your own trend on a fixed definition. Count formal offers only, treat a withdrawn acceptance as a decline, and record every decline reason in a short fixed list. A rate that falls while your interview volume holds steady usually points at pay, at speed, or at the final interview stage.
What is a normal interview to hire ratio?
Nobody publishes a reliable national figure, and the number depends entirely on which interviews you count. A ratio built on first-stage screens is not comparable with one built on panel interviews. Decide which stages count, hold that definition for at least a year, and read the ratio next to your offer acceptance rate.
How many vacancies are hard to fill in the UK?
The Employer Skills Survey 2024 reports a total of 345,300 hard-to-fill vacancies, down from 850,000 in 2022 and similar to 336,800 in 2017. It also reports that approaching two fifths (37%) of current vacancies were described by employers as hard to fill, against 57% in 2022 and 33% in 2017, with the highest density in Construction at 57%.
Your next step: write the definitions before the dashboard
- Write down where your time to hire clock starts and stops, in one sentence each, and recalculate the last four quarters on it.
- Set the boundary for cost per hire, including whether internal time counts, then produce it split by agency and direct.
- Fix the offer acceptance denominator to formal written offers, and add a short fixed list of decline reasons to your process.
- Decide which interview stages feed your interview to hire ratio, and leave that decision alone for a year.
- Take one role you cannot fill and check it against the Employer Skills Survey sector density before you accept that the market is to blame.
For the process these measures describe end to end, read and download our recruitment and selection guide. The guide is free to read, and the PDF uses our short download form.
Want the handover from accepted offer to productive colleague to stop leaking? Book a New Dynamics demo and bring last quarter's hiring report. You can also email contact@new-dynamics.com.