TL;DR
- Average actual weekly hours of work were 32.0 for all workers in June to August 2026, 36.7 for full-time workers and 16.5 for part-time workers, with 1,105.2 million total actual weekly hours worked across the UK. Actual hours are reduced by holiday and sickness, so they sit below contracted hours.
- The number of employees in the UK who were trade union members rose by 192,000 on the year to 6.6 million in 2025, and 22.4% of employees were members. Density was 48.5% in the public sector against 12.1% in the private sector.
- No official UK statistic counts presenteeism. The nearest published measures are the sickness absence rate, which was 2.0% in 2025 with 148.8 million working days lost, and the 964,000 workers in Great Britain with work-related stress, depression or anxiety in 2024/25.
Three questions about working hours get asked together, and only two of them have an answer. How many hours does the average person in the UK actually work? How many employees belong to a trade union? And how much presenteeism is there?
The first two are published, quarterly and annually, by the statistics office and a government department. The third is not published by anybody official, and the honest answer matters more than a borrowed number.
Hours, union coverage and quiet overwork all show up first in what people tell their manager, which is why that record needs to be in one place. See how New Dynamics feedback keeps continuous feedback attached to the person rather than scattered across inboxes.
For the history of the standard working day and where it came from, our post on the 8 hour working day covers the ground this article measures.
Average weekly hours worked in the UK
The series to quote is the Office for National Statistics table HOUR01, described as "Actual weekly hours worked including by sex, full-time, part-time and second jobs, UK, rolling three-monthly figures published monthly, seasonally adjusted". The October 2026 edition was released on 20 October 2026 and runs to June to August 2026.
For June to August 2026, average actual weekly hours of work were:
| Group | Average actual weekly hours |
|---|---|
| All workers | 32.0 |
| Full-time workers | 36.7 |
| Part-time workers | 16.5 |
| Second jobs | 9.8 |
Total weekly hours across the UK were 1,105.2 million in the same period, a figure the ONS also reports in Employment in the UK: October 2026, where it notes that "Total actual weekly hours worked increased both over the year and in the latest quarter" and that "Average actual weekly hours worked increased over the year but remained largely unchanged in the latest quarter."

A year earlier, in June to August 2025, the same table put all workers on 31.8 hours, full-time workers on 36.5 and part-time workers on 16.5. The movement is small, which is the point. Average hours are a slow series, and treating a tenth of an hour as a trend is a mistake.
Three qualifications travel with these numbers.
The all-workers figure covers main and second job together. The full-time and part-time figures cover the main job only, per the table's own footnotes. So you cannot add or average them into the headline.
Actual hours are not contracted hours. The series measures hours actually worked, so a week containing annual leave, a bank holiday or sickness pulls the average down. This is why 36.7 hours for a full-time worker sits below a typical full-time contract.
The ONS asks you not to compare overlapping quarters. The table carries the note: "When comparing quarterly changes ONS recommends comparing with the previous non-overlapping 3-month average time period (eg, compare Apr-Jun with Jan-Mar, not with Mar-May)."
One more caveat belongs in any current quote. The Labour market overview, UK: October 2026 states that "An LFS operational issue occurred in May 2026, which led to temporary under-resourcing in LFS telephone collection operations", and that the analysis "does suggest there is a small but noticeable impact on the estimates of average hours and therefore the total actual hours worked." That is the publisher's own warning, attached to the hours series specifically.
Usual hours tell you who the long-hours group is
The averages hide the distribution, and the distribution is the interesting part. The companion table HOUR02 reports usual weekly hours in the main job in bands. For June to August 2026, out of 34,577,300 people in employment, usual weekly hours in the main job fell out as 1.4% working under 6 hours, 6.1% working 6 up to 15 hours, 18.5% working 16 up to 30 hours, 59.3% working 31 up to 45 hours and 14.6% working over 45 hours.
That last band is about 5.0 million people who usually work more than 45 hours a week in their main job. An average of 32.0 hours and five million people on long hours are both true at once, and only one of them describes a wellbeing risk.
The 48 hour limit, and which jurisdiction you are in
Working hours are also a legal question, and the legal answer is not UK-wide in origin.
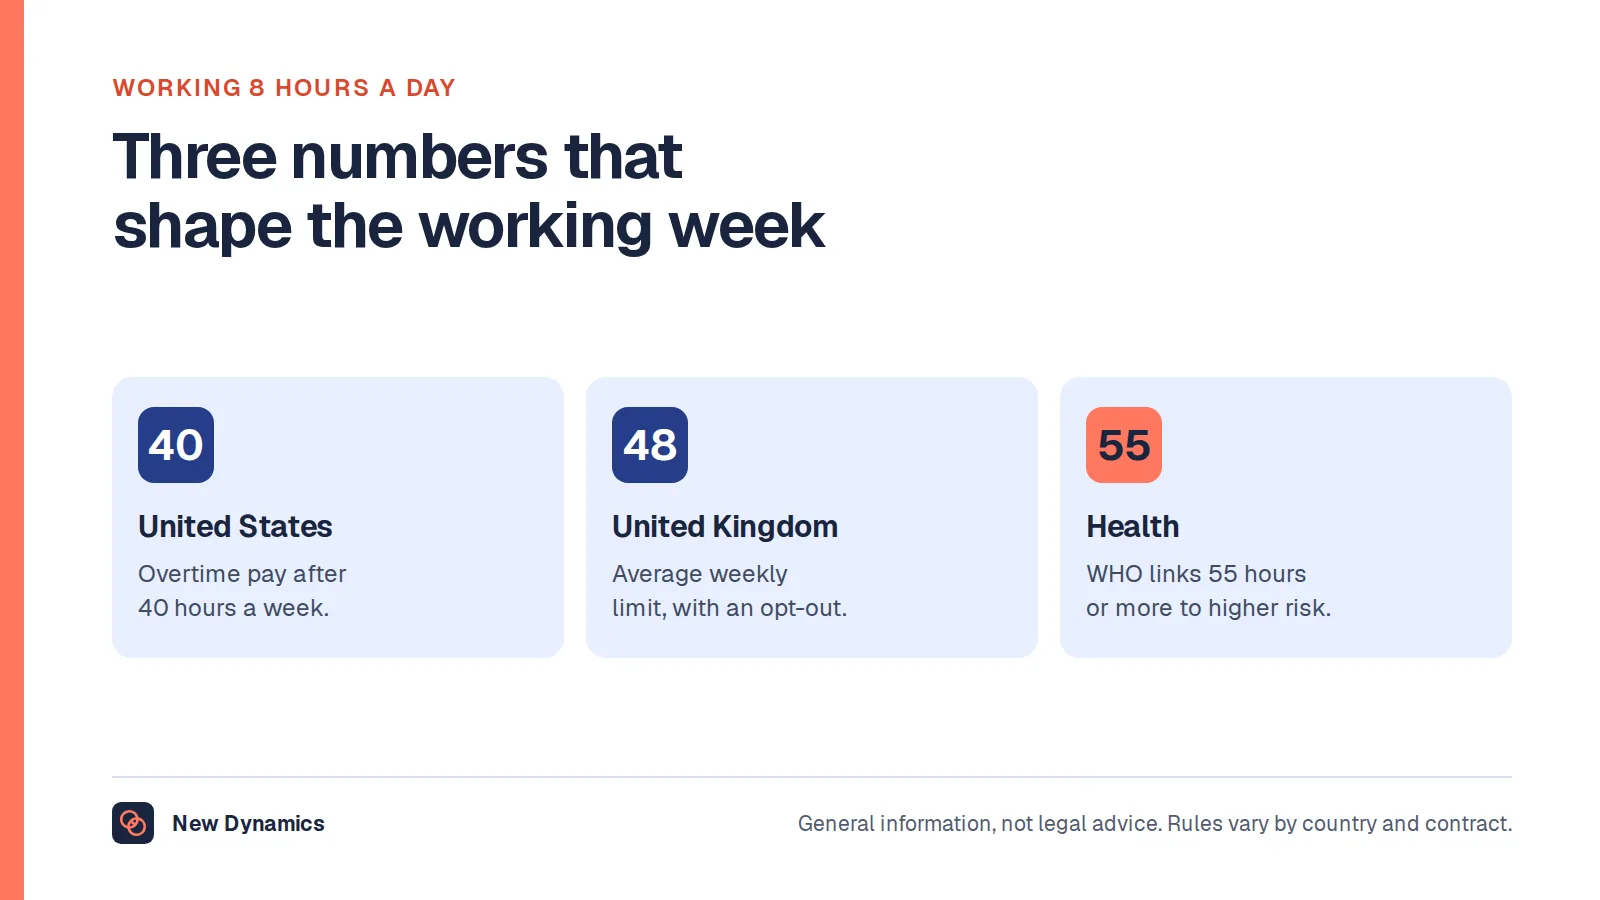
In England, Scotland and Wales, the limit comes from the Working Time Regulations 1998. Regulation 4 provides that "a worker's working time, including overtime, in any reference period which is applicable in his case shall not exceed an average of 48 hours for each seven days". The gov.uk guidance puts the same rule plainly: "You cannot work more than 48 hours a week on average", "normally averaged over 17 weeks". For under-18s it adds that "If you're under 18, you cannot work more than 8 hours a day or 40 hours a week."
On the opt out, the gov.uk page on opting out says "You can choose to work more than 48 hours a week on average if you're over 18", that the agreement must be "voluntary and in writing", that "Your employer must keep a record that you've opted out", and that "Your employer can ask you to opt out, but you cannot be sacked or treated unfairly for refusing."
Northern Ireland has its own equivalent, published separately. The nidirect guidance on working time limits says "Most workers should not have to work more than an average of 48 hours a week, according to the Working Time Regulations", that "Your average working hours are calculated over a 17-week period" and that an opt out "must be voluntary and in writing."
So the practical rule is the same in all four nations, but the instrument is not, and a handbook that cites only the 1998 regulations is citing the wrong law for a Belfast employee. This article is general information about published statistics and published rules, not legal advice. Take advice on your own obligations before writing policy.
Trade union membership statistics for the UK
The annual source is the Department for Business and Trade. The current edition is Trade union membership, UK, 1995 to 2025: statistical bulletin, published on 28 May 2026 and covering 2025.
It reports that "The number of employees in the UK who were trade union members rose by 192,000 on the year to 6.6 million" and that "The proportion of UK employees who were trade union members rose from 22.0% in 2024 to 22.4% in 2025."

The sector split is the figure most people actually need. The bulletin states that "In 2025, the overall proportion of employees who are members of trade unions continued to be significantly higher in the public sector (48.5%) relative to the private sector (12.1%)." Membership rose in both: "Trade union membership among employees rose in the private sector by 76,000 on the year to 2.5 million in 2025", and "There was a slightly bigger increase in trade union membership among public sector employees of 116,000 to 4.0 million in 2025."
Two further findings are worth carrying into any workforce conversation.
Membership tracks tenure. The bulletin reports that "Over 4-in-10 (43%) employees who were trade union members had been with their current employer for 10 years or more, compared to under a quarter (24%) of non-union member employees." Read it as an association rather than a cause. Long service and union membership both concentrate in the same places, notably the public sector, so this is not evidence that joining a union keeps somebody in post.
The membership is older than the workforce. Among union members in 2025, 37.1% were aged 50 or older, while 4.5% were aged between 16 and 24.
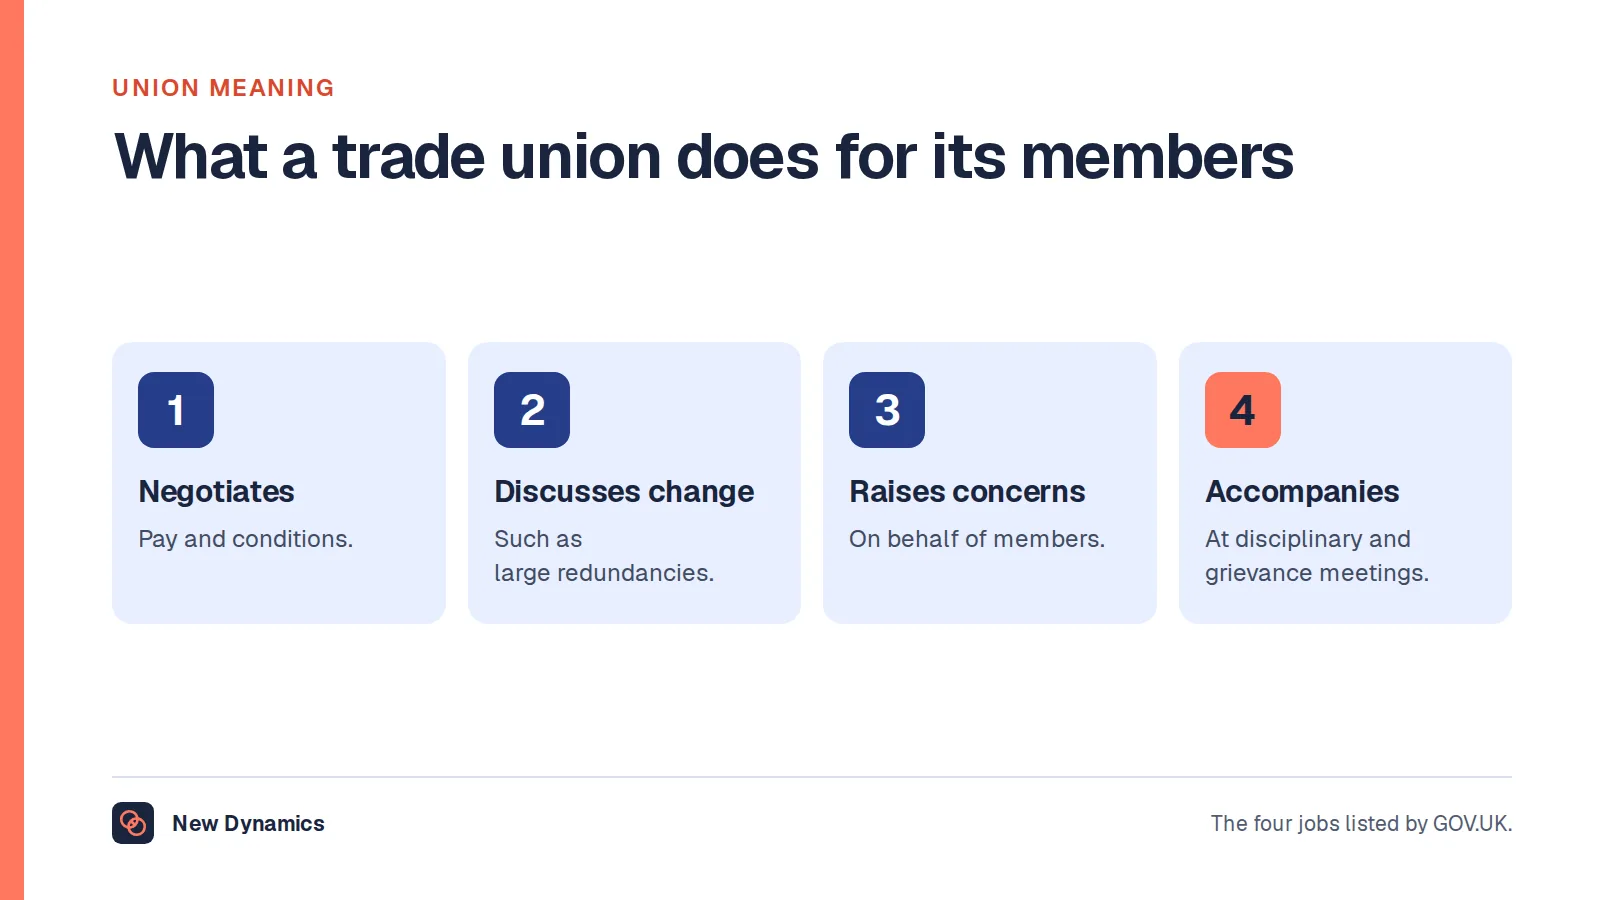
For the mechanism behind these numbers, our post on the trade union explains what membership and recognition actually do inside an employer.
Presenteeism statistics: the number nobody publishes
Search for presenteeism statistics and you will find a cost to the economy, a percentage of staff who work while ill and a number of days lost, all attributed to surveys of self-selecting respondents. No official UK statistic counts presenteeism. Not the ONS, not the Health and Safety Executive, not any government department.
That is not an oversight. Presenteeism means being at work while too unwell to be productive, and neither half of that is observable in administrative data. Attendance is recorded. Illness while attending is not. Lost productivity while present is not measured for any individual, anywhere, by anybody official. A survey can ask people whether they have done it, which produces a self-reported percentage from one panel and not a national statistic.
So the honest position is this. Presenteeism is a real phenomenon with no official UK measure, and the figures in circulation describe the panel that answered rather than the country.
What sickness absence and work-related stress do measure
Three published series sit next to presenteeism and are worth using in its place.

The sickness absence rate. The ONS article Sickness absence in the UK labour market: 2025, released on 1 May 2026, reports that "The sickness absence rate in 2025 was 2.0%, which is unchanged from 2024" and that "An estimated 148.8 million working days were lost because of sickness or injury in 2025; this is, on average, 4.4 days lost per worker." It records minor illnesses as the most common reason, "accounting for 30.4% of occurrences" in 2025, with mental health conditions at 8.9%.
The recent record. The 2022 edition of the same article reports that "The sickness absence rate - the percentage of working hours lost because of sickness or injury rose to 2.6% in 2022", that it "is now at its highest point since 2004, when it was 2.7%", and that "An estimated 185.6 million working days were lost because of sickness or injury in 2022; this level was a record high". Quoting 2.6% today, as many articles still do, is quoting a figure four reference years out of date.
Work-related stress. The HSE's key figures for Great Britain report "964,000 workers suffering work-related stress, depression or anxiety" in 2024/25, and "40.1 million working days lost due to work-related illness and workplace injury". Its working days lost figures attribute 22.1 million of those days to stress, depression or anxiety in 2024/25, in Great Britain.
Here is the link back to presenteeism. A falling absence rate alongside high work-related stress is exactly the pattern that worries occupational health, because absence can fall for a good reason (people are well) or a bad one (people are unwell and attending anyway). The published statistics cannot tell you which. Your own data can.
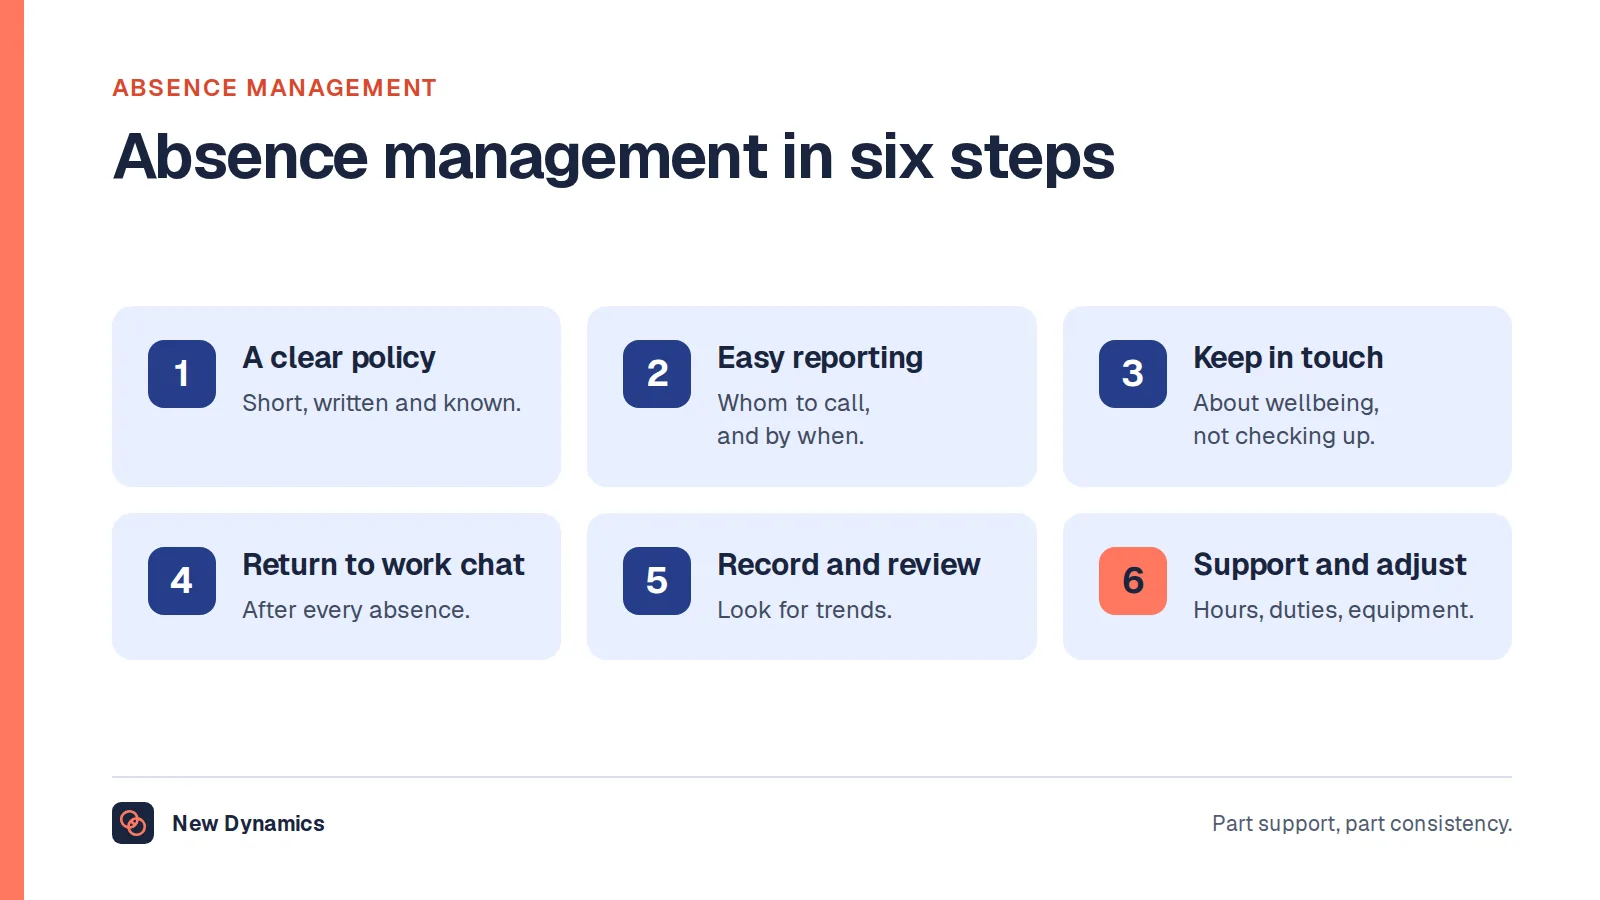
Our post on absence management covers the process side of this, and the wider set of published UK workforce figures sits in our HR statistics hub with the publisher and period attached to each one.
What to measure in your own organisation
- Actual hours against contracted hours, by team. The national gap between 36.7 and a full-time contract is holiday and sickness. A persistent gap in the other direction, where actual exceeds contracted, is unpaid overtime and it is yours to find.
- The share of people usually working over 45 hours. The national figure is 14.6% of those in employment. Your own share is a workload signal and a wellbeing signal in one number.
- Opt-out coverage. Count the signed opt outs you hold, when each was signed, and whether anyone has withdrawn one. The record-keeping duty is explicit in the guidance.
- Absence and attendance together. Absence rate alone is ambiguous. Pair it with short-notice absence, leave not taken and out-of-hours activity before you call a falling rate good news.
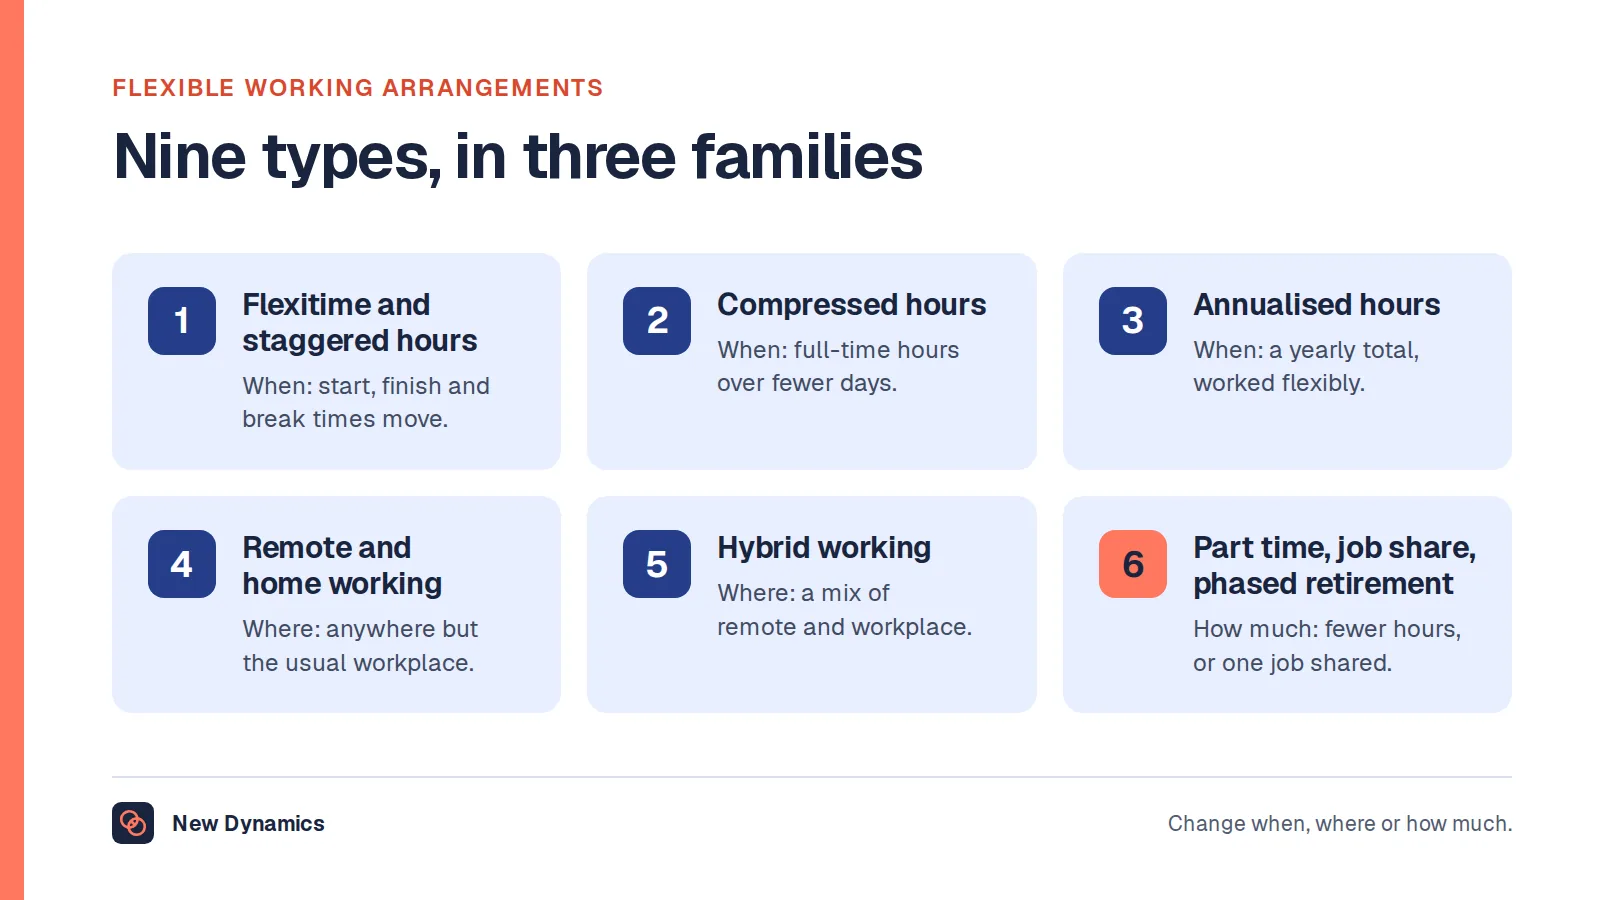
- What people say about workload, in writing, through the year. Presenteeism is unmeasurable from the outside and reportable from the inside. A regular one-to-one record that captures hours and workload is the only instrument most employers will ever have, and our post on flexible working arrangements covers the patterns that usually come up.
What usually goes wrong
- Quoting 32.0 hours as the average working week. It is average actual hours, reduced by absence, and it mixes full-time and part-time workers.
- Averaging the full-time and part-time figures. They cover the main job only. The all-workers figure covers main and second job.
- Comparing overlapping three-month periods, against the publisher's own advice.
- Treating 22.4% union density as uniform. It is 48.5% in the public sector and 12.1% in the private sector, and a sector average tells you very little about one employer.
- Reading the tenure finding as cause and effect. Union members are more likely to have ten years' service. That is not evidence that membership produced the service.
- Citing a presenteeism statistic as though it were official. None is.
- Still quoting a 2.6% sickness absence rate. That was 2022. The published rate for 2025 is 2.0%.
Frequently asked questions
What is the average weekly hours worked in the UK?
Average actual weekly hours of work were 32.0 for all workers in June to August 2026, according to ONS table HOUR01, released on 20 October 2026. Full-time workers averaged 36.7 hours and part-time workers 16.5 hours in their main job. The all-workers figure covers main and second jobs together.
Why is the average full-time working week under 37 hours?
Because the series measures hours actually worked, not hours contracted. Annual leave, bank holidays, sickness and any short week all reduce actual hours. The ONS publishes a separate usual-hours table for contracted patterns, and in June to August 2026 it put 59.3% of people in employment on usual hours of 31 up to 45 a week.
How many people in the UK are in a trade union?
The number of employees in the UK who were trade union members rose by 192,000 on the year to 6.6 million in 2025, and 22.4% of UK employees were members, up from 22.0% in 2024. The Department for Business and Trade published those figures on 28 May 2026.
Is union membership higher in the public or private sector?
The public sector, by a wide margin. In 2025 density was 48.5% in the public sector against 12.1% in the private sector. Public sector membership rose by 116,000 to 4.0 million and private sector membership by 76,000 to 2.5 million.
Are there official presenteeism statistics for the UK?
No. No UK official body publishes a presenteeism figure, because working while unwell is not recorded anywhere in administrative data. The closest official measures are the sickness absence rate, which was 2.0% in 2025 with 148.8 million working days lost, and the HSE count of 964,000 workers in Great Britain with work-related stress, depression or anxiety in 2024/25.
Can an employee work more than 48 hours a week?
Yes, by opting out in writing, if they are over 18. In England, Scotland and Wales the Working Time Regulations 1998 cap working time at an average of 48 hours over a reference period normally of 17 weeks, and Northern Ireland has an equivalent regime. The opt out must be voluntary, and gov.uk states that you cannot be sacked or treated unfairly for refusing. This is general information rather than legal advice.
Your next step: quote the right series, then measure your own hours
- Decide whether you need actual hours or usual hours, and name the table you took the figure from.
- Write the reference period next to every number, because all of these move and most of the versions in circulation are stale.
- Check which jurisdiction your working time policy cites, and whether it covers Northern Ireland.
- Stop looking for a presenteeism benchmark. Pair your absence rate with workload evidence from your own one-to-ones instead.
To set up working norms and assess contribution without counting presence, read and download our remote and hybrid work guide. The guide is free to read, and the PDF uses our short download form.
Want workload and hours raised in writing through the year, rather than guessed at from an attendance report? Book a New Dynamics demo and bring your current one-to-one template. You can also email contact@new-dynamics.com.