TL;DR
- No official UK body publishes an average span of control. The nearest published figures describe grade structure and occupation, not reporting lines: 75.5% of civil servants worked at Executive Officer grade and above as at 31 March 2026, and 12.8% of people in employment in England and Wales were managers, directors and senior officials at Census 2021.
- The arithmetic is simple. Average span of control is the number of people who report to somebody, divided by the number of people who have at least one direct report. The hard part is deciding who counts, and the average usually describes nobody in the organisation.
- Six things move the right answer: work complexity and risk, how new the team is, co-location, shift patterns, how much coaching the role needs, and how much the manager does besides managing. Set a range per type of work, then look at the outliers.
Someone asks how many people a manager should have reporting to them, and expects a number back. Six. Eight. Twelve. There is a whole literature of confident answers, and most of them are a number somebody once used in one organisation, repeated until it sounded like a standard.
The honest position is this. No official United Kingdom statistic publishes an average span of control, and a single number would be close to useless if it did, because the right span for a nightshift warehouse team is wrong for a team of four researchers. What can be done is the arithmetic, and the list of things that genuinely move the answer.
Spans are easier to argue about when everyone can see the current shape of the organisation. See how New Dynamics org charts show reporting lines, team sizes and open roles in one place.
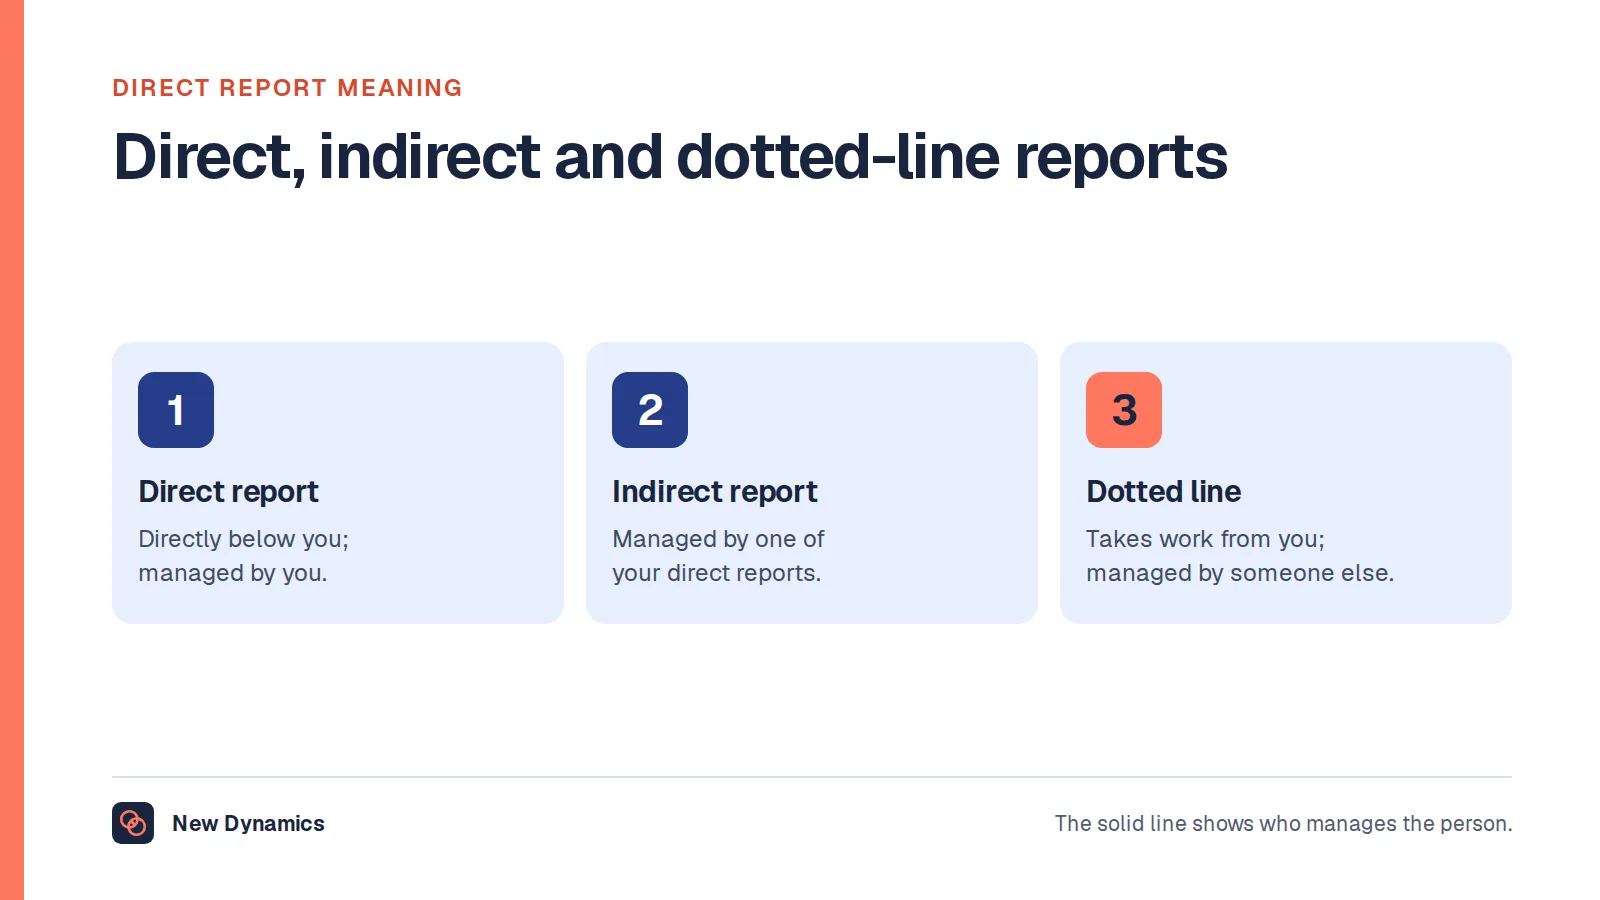
For who counts as a report in the first place, our post on the meaning of a direct report sets out the definitions this calculation depends on.
There is no official UK average span of control
This is worth saying plainly, because the figure is often quoted as though it were published somewhere.
The Office for National Statistics does not publish a span of control series. The nearest thing it ever held, the employment by occupation dataset, carries a notice saying "This dataset has now been discontinued following a user consultation. However figures for employment by occupation, sourced from our Annual Population Survey are available on our NOMIS website." Occupation is not a reporting line. Someone can hold a manager's job title and have nobody reporting to them.
What official statistics do publish is how many people hold senior or managerial roles. From Census 2021, with a reference date of 21 March 2021 and the bulletin released on 8 December 2022, the ONS reports that in England and Wales people were employed as "managers, directors and senior officials (12.8%, 3.5 million)". That is an occupational share, not a span. It does not say how many people each of those 3.5 million supervises, or whether they supervise anyone at all.

The Civil Service publishes grade structure, which is the closest any large United Kingdom employer gets to a public view of its shape. Civil Service Statistics 2026, as at 31 March 2026 and updated on 28 October 2026, reports that "Civil Service headcount stands at 557,825 as at 31 March 2026" and that "Just over three quarters (75.5%) of civil servants work at Executive Office (EO) grade and above". The same bulletin records that the proportion in the most junior grades "has fallen each year since 2016, when it stood at 37.9%, and is now less than a quarter of the workforce for the first time (24.5%)", while the share in grades 6 and 7 "has increased to 16.7%, up from 16.2% in 2025 and 9.7% in 2016".
Read that carefully, because it is tempting to turn it into a ratio. A grade is a pay and responsibility level, not a reporting relationship. A grade 7 may lead fifteen people or none.
The NHS is the same story at larger scale. NHS Workforce Statistics for August 2026, published on 29 October 2026, reports "1,370,051 FTE in August 2026" in NHS Trusts and integrated care boards in England, broken down by staff group and care setting. Managers and senior managers appear there as staff groups with their own counts. A staff group count divided by total staff is not a span of control either, because clinical and professional staff supervise people without being counted as managers.
So the number does not exist. Anyone presenting an average span of control as a national benchmark is presenting their own panel, or their own employer, as the country.
The span of control formula
Three related numbers get confused with each other. Keep them apart.
One manager's span of control is simply the number of people who report directly to that manager.
Average span of control is the number of people who report to somebody, divided by the number of people who have at least one direct report.
Manager to employee ratio is the same relationship upside down: the number of people with at least one direct report, divided by total headcount, usually quoted as a percentage or as one in something.

Before you divide anything, settle four definitions, and write them down so next quarter's figure means the same thing.
- Who counts as a manager? Only people with at least one direct report. Not everyone with "manager" in the job title, and not people who lead projects without line responsibility.
- What about dotted lines? A matrix report takes real time from the second manager. Count them separately rather than ignoring them, then report both figures.
- Do vacancies count? An approved and unfilled role is not a person to supervise, but it is a gap in the team's capacity. Count filled roles for the span and track vacancies alongside.
- Do part-time, agency and contract people count? Anyone whose work you direct needs supervising. Counting only permanent employees understates several teams badly, particularly in retail, care and hospitality.
A worked example, with made-up numbers
The figures below are invented to show the arithmetic. They are an example, not a benchmark, and no part of them should be treated as a target.
Take an imaginary organisation of 240 people. One chief executive reports to nobody, so 239 people report to somebody. Thirty-two people have at least one direct report.
- Average span of control: 239 divided by 32, which is 7.5 reports per manager.
- Manager to employee ratio: 32 divided by 240, which is 13.3% of headcount, or roughly one manager for every seven and a half people.
Now split that same organisation by team. A contact centre team leader has 18 reports spread over two shift patterns. A product team lead has 5. A field engineering supervisor has 11 people working across six sites. A finance manager has 2.
The average, 7.5, describes none of those four jobs. That is the normal result, not a sign of a badly run organisation. It is why the average is a planning input and never a verdict on an individual manager.
Publish the spread, not the mean
Once you have the per-manager numbers, the useful output is a distribution rather than a single figure. Three groups repay attention immediately.
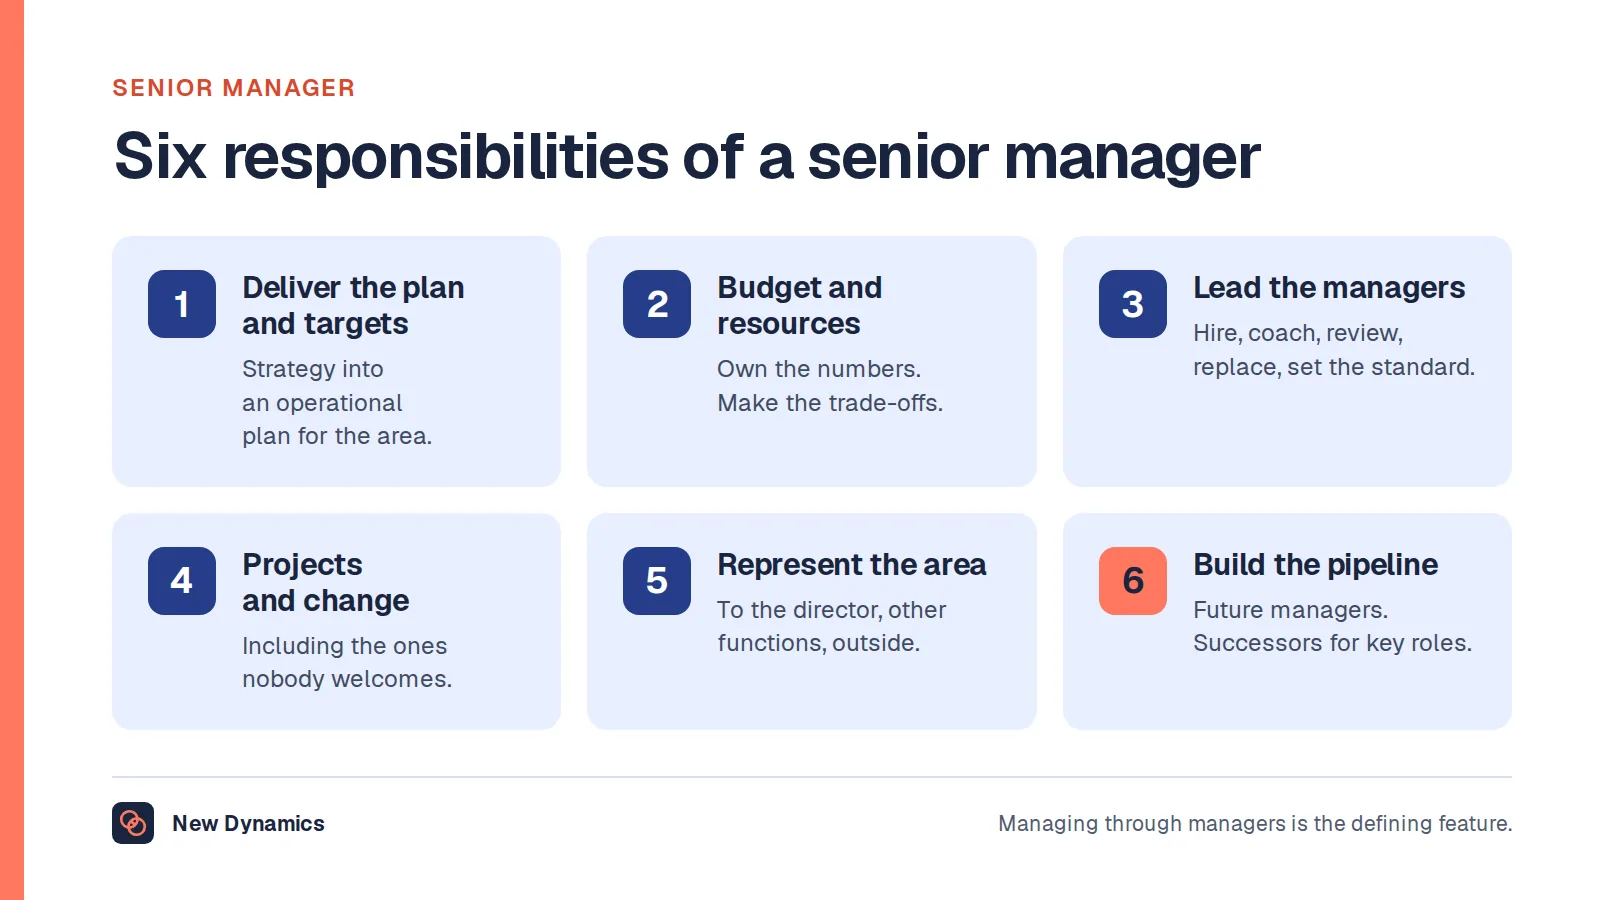
Managers with one or two reports. Often this is a job title used as a reward, or a structure left behind after someone left. It is expensive, it adds a layer between the work and the decision, and it usually means somebody has been promoted out of work they were good at. Our post on what makes a senior manager covers the difference between scope and a title.
Managers above about fifteen reports. Not automatically wrong. Entirely wrong if the role involves daily coaching, probation reviews, or safety supervision of inexperienced people.
Managers of managers. Spans at that level are usually narrower, because the work is harder to batch. If a director has twelve direct reports who each run a team, nobody is getting much of their attention.
Six things that change the right answer

Work complexity and risk. The Health and Safety Executive's guidance for workers who are new to the job says: "Provide adequate supervision. Make sure workers know how to raise concerns." Adequate is the operative word. Adequate supervision of a trained analyst and of a first-week operative on machinery are different quantities of a manager's week.
How new the team is. The same HSE guidance states that "Workers are as likely to have an accident in their first 6 months at work as during the whole of the rest of their working life." A team of ten experienced people and a team of ten people hired in the last quarter are not the same management job, even with identical job descriptions.
Co-location. People in one room ask each other questions and the manager overhears problems. Spread the same ten people across six sites or six home offices and every one of those exchanges has to be deliberately arranged.
Shift patterns. A manager who is present for part of the week their team works has a smaller real span than their org chart shows. Night and weekend cover usually needs its own supervisory line rather than a wider daytime one.
How much coaching the role needs. Acas is explicit that reviews are not the whole job: "Alongside more formal performance reviews, managers should still talk to employees informally about their performance on a regular basis." Regular one to ones, feedback and development conversations are the work that gets quietly dropped first when a span is too wide. Our post on one to one meeting questions covers what those conversations need to contain.
How much the manager does besides managing. A team leader carrying a full caseload has perhaps a day a week for people work. A full-time manager has five. Treating both as the same span is the most common mistake in this whole exercise.
What a span that is too wide looks like from the inside
You do not need a benchmark to know whether spans are working, because the people being managed will tell you. The NHS Staff Survey is a useful comparison here, because it asks the question of hundreds of thousands of people. The 2025 National Results Briefing, with 766,285 staff responding at a 49% response rate, reports that "In 2025, the 'Line management' sub-score is 6.92 which is its highest level since it was first reported in 2021".
Underneath that score, 66.55% say their immediate manager gives them clear feedback on their work, against 62.43% in 2021, and 60.05% say their immediate manager asks for their opinion before making decisions that affect their work, against 57.12% in 2021.
Those are not span of control statistics, and nobody should quote them as one. They are the output measure that a span of control decision is meant to protect. Ask your own people the same questions, split the answers by team size, and you will have better evidence than any published average could give you. The wider figures the United Kingdom does publish on work and the workforce are collected in our HR statistics hub.
Three other symptoms show up before a survey does: one to ones being cancelled rather than moved, reviews arriving late in every cycle under one manager, and decisions queueing because only one person can approve them. Our post on skip-level meetings covers how senior leaders hear about the first two.
Frequently asked questions
What is a good span of control?
A range, not a number. For stable, co-located work with experienced people, spans in the low double figures are common and manageable. Where the work is risky, the team is new, or the manager is also carrying delivery work, the same span becomes unmanageable. Set the range by type of work, then review every manager who falls outside it.
How do you calculate span of control?
Divide the number of people who report to somebody by the number of people who have at least one direct report. For one manager, it is simply a count of their direct reports. Decide first whether dotted-line reports, vacancies, part-time staff and contractors are in or out, and record that definition so next quarter is comparable.
What is the average span of control in the UK?
No official source publishes one. The ONS discontinued its employment by occupation dataset and publishes occupational shares instead, the Civil Service publishes grade structure, and the NHS publishes staff group counts. None of those is a reporting ratio, so any national average you are shown comes from a private survey panel.
What is a good manager to employee ratio?
It is the span of control question restated, so the answer is the same. If 13% of your headcount has at least one direct report, that implies an average span of about seven and a half. Whether that is right depends on what those teams do, not on the percentage.
Is a span of control of 15 too wide?
Fifteen experienced people doing similar work in one place, managed by somebody with no delivery workload, is demanding but workable. Fifteen people across three sites and two shifts, with four of them in their first six months, is not. The number alone cannot answer the question.
Does a flatter structure always mean wider spans?
Yes, and that is the trade-off people forget. Removing a layer moves its reports to the layer above. Flattening works when the teams underneath can run with less supervision, and fails when the organisation simply stops supervising. Decide which jobs the removed layer was doing, and where each one now sits.
Your next step: count it, split it, then set a range
- Count your current spans, one manager at a time, using a written definition of who counts.
- Work out the average and the distribution, then list every manager with fewer than three reports and every manager above fifteen.
- For each of those outliers, check the six factors: complexity, team tenure, co-location, shift cover, coaching load and the manager's own delivery work.
- Set a working range for each type of work instead of one organisational number, and recount at the same point in each cycle so the trend means something.
- Ask your own people the line management questions, and compare the answers with team size.
For the conversations that a workable span is supposed to make room for, read and download our manager one to one guide. The guide is free to read, and the PDF uses our short download form. Our post on HR structure covers the same decisions one level up.
Want your reporting lines, team sizes and vacancies visible in one view? Book a New Dynamics demo and bring your current org chart. You can also email contact@new-dynamics.com.