TL;DR
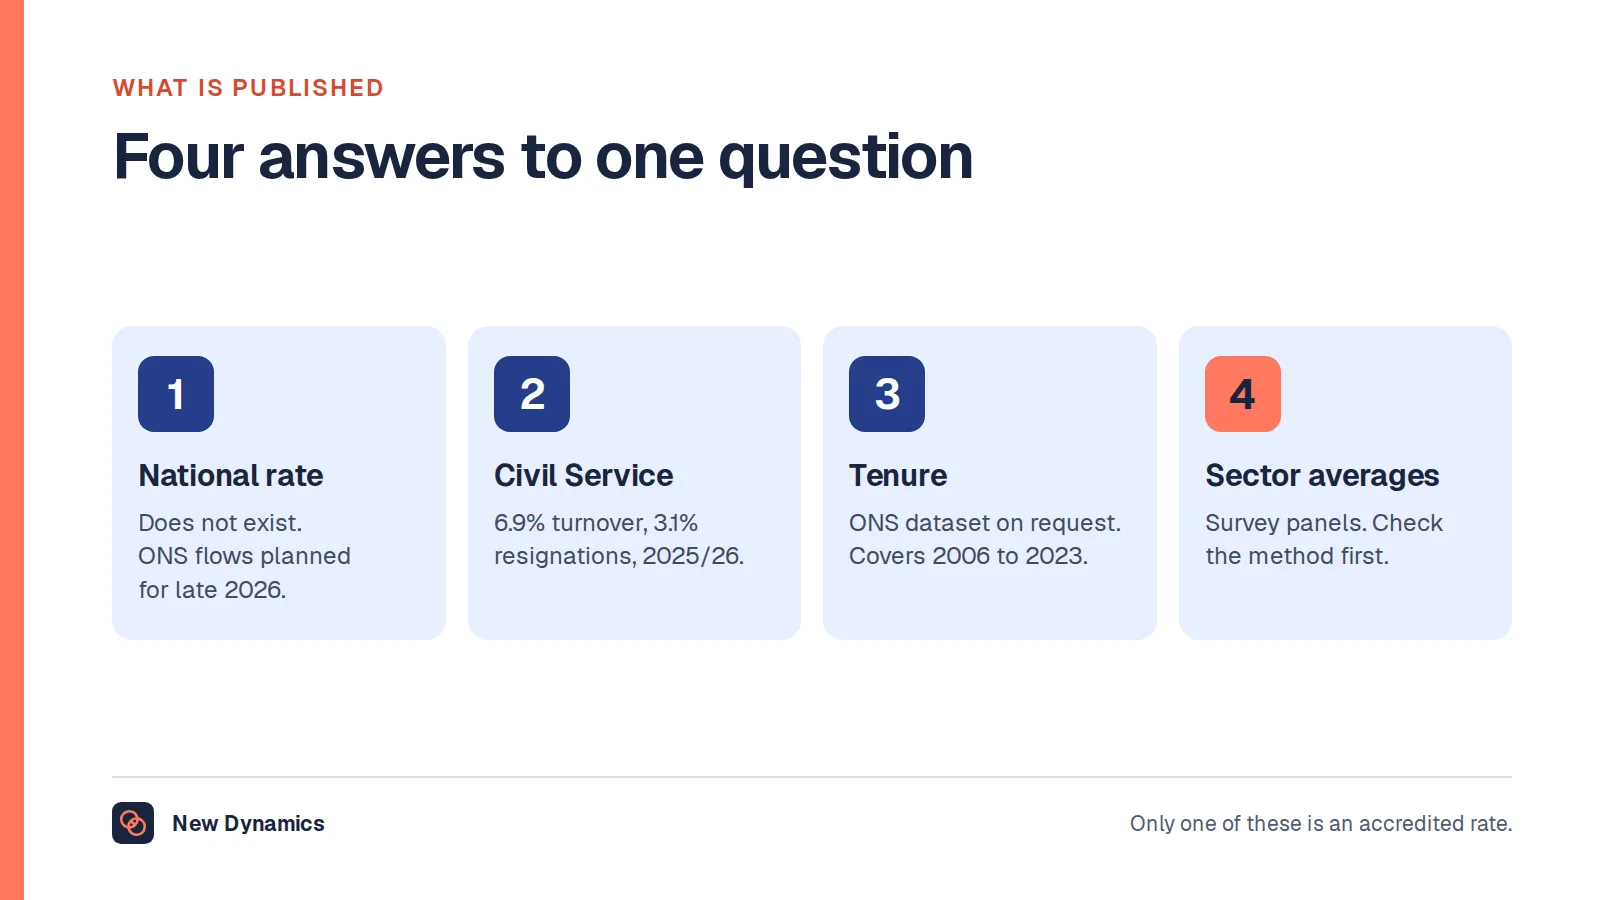
- Two large UK employers publish an engagement score you can check. The Civil Service engagement index was 65% in 2025, up one percentage point, ranging from 57% to 71% across its main organisations. The NHS Staff Engagement theme score was 6.75 out of 10 in 2025, down 0.10 on 2024.
- They cannot be compared with each other. One is a percentage built from five agreement statements, the other a 0 to 10 score built from nine questions in three sub-scores. The instrument defines the number.
- Response rates in both were falling: 59% in the Civil Service, down from 61%, and 49% in the NHS, down from 51%. No official UK source publishes an employee net promoter score benchmark or a national job satisfaction series.
Somebody wants to know whether 7.2 is good. Or 68%. Or whatever number came back from the survey last month. The honest answer is that it depends entirely on which questions produced it, and that almost no published benchmark tells you.
This article covers the two UK engagement scores you can genuinely check, why they do not compare, what response rates actually run at, and what to measure instead.
A score is a prompt for a conversation, not a substitute for one. See how New Dynamics continuous feedback keeps the detail behind a number visible all year.
If you are designing the survey rather than interpreting one, our post on the workplace engagement survey covers the questions.
Two scores you can check

The Civil Service. The Civil Service People Survey 2025 results, published on 28 May 2026, report that "The employee engagement index for the Civil Service was up compared to 2024 at 65%", a rise of one percentage point. Across the main organisations the index "ranged from 57% to 71%".
The index is a summary of five questions covering how proud staff feel to work for their organisation, whether they would recommend it as a great place to work, whether they feel a strong personal attachment to it, and whether it inspires and motivates them.
The NHS. The 2025 NHS Staff Survey national results briefing, published in March 2026, gives a Staff Engagement theme score of 6.75, against 6.85 in 2024, 6.89 in 2023, 6.79 in 2022 and 6.84 in 2021. The briefing states plainly: "The Staff Engagement score has decreased by 0.10 since 2024."
That score is built from nine questions in three sub-scores, Advocacy, Motivation and Involvement, and summary indicators are "scored for all appropriate response options ... on a scale that ranges from 0 to 10, where a higher score always equates to a more positive outcome".
Two large, serious, published measures. Both are accurate. Neither tells you whether your 7.2 is good.
Why they do not compare

Five differences, any one of which would be enough.
- The scale. A percentage index and a 0 to 10 mean score are different objects. Converting one to the other produces a number with no meaning.
- The questions. Five agreement statements about pride and advocacy, against nine questions spanning advocacy, motivation and involvement. Add a question about workload and the score moves.
- The population. Civil servants and NHS staff do different work under different pressures. So do your people.
- The response rate. A survey answered by 49% of staff is a different sample from one answered by 59%, and both differ from a 90% response in a small team.
- The year. One of these went up and the other went down in the same twelve months.
The general rule holds for any benchmark you are offered: if the publisher does not state the questions, the scale, the population and the response rate, the number cannot be compared with yours.
What response rates actually run at
This is the benchmark people ask for least and should ask for most, because it decides how much the score is worth.
Both national surveys report theirs, and both were falling. The Civil Service People Survey 2025 had a response rate of 59%, down from 61% in 2024, with 343,961 civil servants from 102 organisations responding. The 2025 NHS Staff Survey reports a "49% response rate (down from 51% in 2024)" with 766,285 staff responding, against 774,820 the year before.
Two things follow. A response rate under two thirds is normal at very large scale, so a lower rate is not automatically a failure. And a falling response rate matters more than a small move in the score, because the people who stop answering are rarely a random sample.
There is no UK eNPS benchmark
No official United Kingdom source publishes an employee net promoter score. The figures in circulation come from commercial panels, and the composition of those panels is usually not published.
The measure has a second problem beyond sourcing. It compresses one question into a single number by subtracting detractors from promoters, so two organisations with completely different distributions can score the same. It is a reasonable tracking question for your own trend. It is a poor basis for comparison with anyone else.
If you use it, use it as one question inside a survey that also asks why, and compare it only with your own previous answer.
"Disengaged employees" is not a published UK statistic
Neither national survey classifies people as engaged or disengaged. Both produce a score, not a headcount. The widely quoted percentages of disengaged workers come from commercial global research with its own definitions and panels, and they are not a measurement of the United Kingdom workforce.
If you want to know who is struggling, ask a question that identifies it and act on the answer. A share of a population derived from somebody else's model cannot tell you which of your teams needs attention.
Employee satisfaction statistics for the UK
There is no national job satisfaction series published as an official statistic. What exists are the sector surveys above, each measuring its own population with its own instrument.
That is a genuine gap, and it is worth knowing about rather than filling with a number from a press release. For the figures the United Kingdom does publish on work, absence, pay, vacancies and the workforce, our HR statistics hub collects them with the publisher and the period attached to each one.
What to compare against instead

Your own score, on unchanged questions. Three years of the same five or six outcome questions beats any external average. Change the wording and you have started a new series.
Your own distribution, not the mean. A mean of 7 made of sevens is a different organisation from a mean of 7 made of nines and fives.
Your own split by group. By team, by site, by length of service, by shift, by manager. The gap between your best and worst team is the number that tells you what to do on Monday.
Your own response rate, tracked. Falling participation is the first signal that people have stopped believing anything happens afterwards.
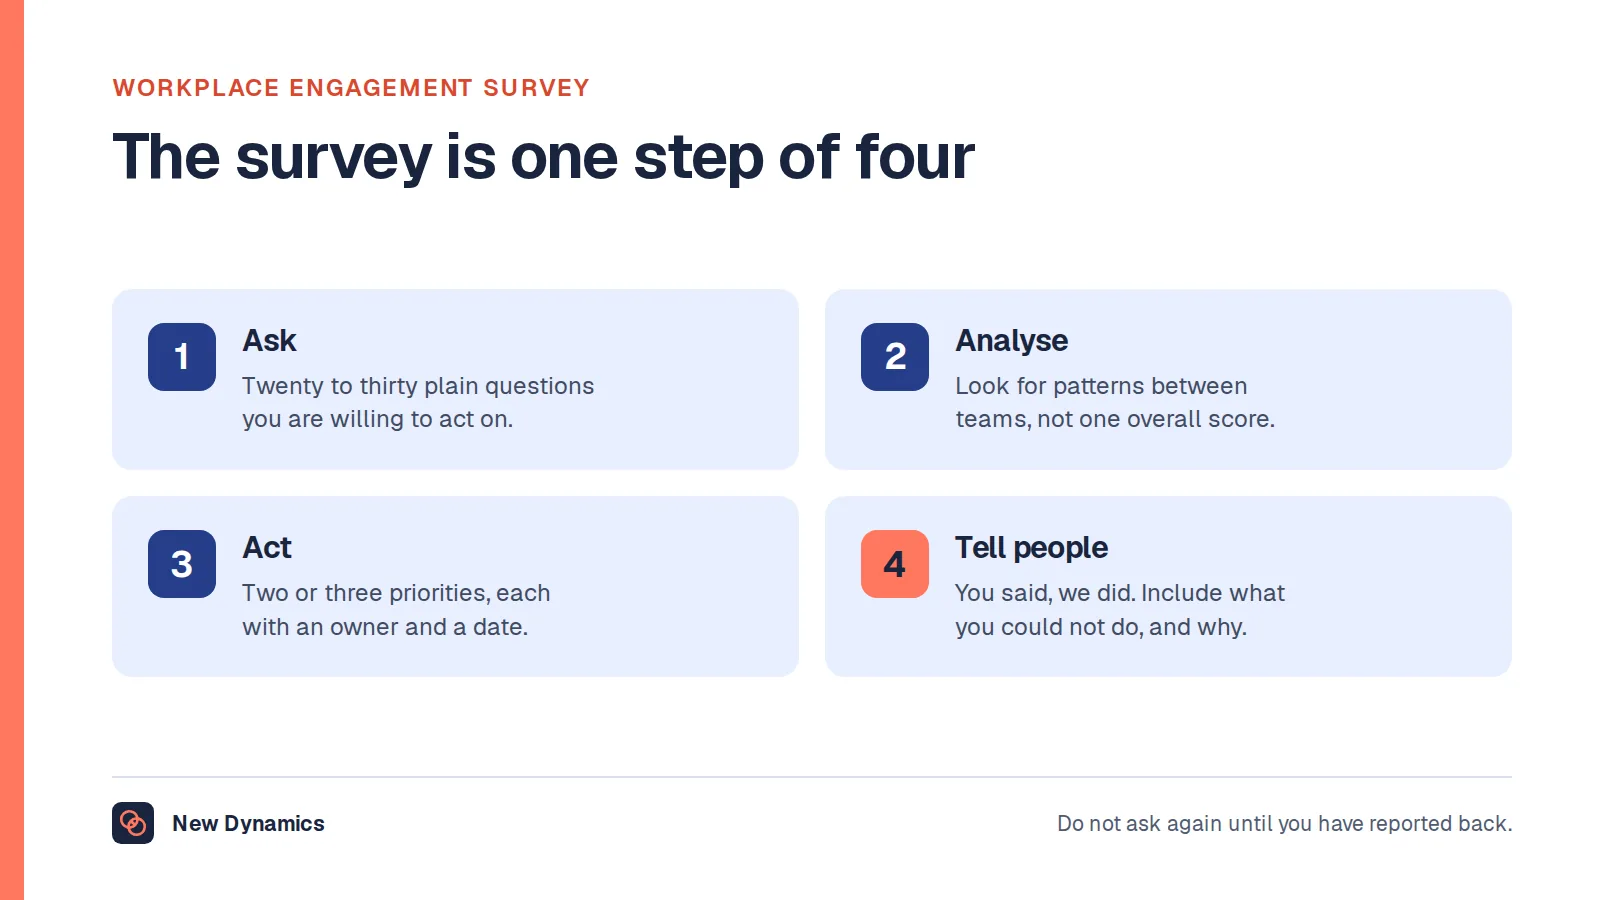
What changed since the last survey. The most informative question in any engagement survey is whether people saw action on the previous one.
What usually goes wrong
- Comparing a score with a benchmark built from different questions, which is most comparisons.
- Changing the questions between years, which quietly ends the trend.
- Reporting the mean alone, which hides the distribution that matters.
- Treating a falling response rate as an administrative problem rather than a result in itself.
- Quoting a global percentage of disengaged workers as though it described your workforce.
- Running the survey again before acting on the last one.
Frequently asked questions
What is a good employee engagement score?
There is no transferable answer, because the number depends on the questions, the scale and the population. The two published UK reference points are the Civil Service engagement index at 65% in 2025 and the NHS Staff Engagement theme score at 6.75 out of 10, and the two cannot be compared with each other.
What is the average employee engagement score in the UK?
None is published. The Civil Service index was 65% in 2025, ranging from 57% to 71% across its main organisations, and the NHS theme score was 6.75 out of 10. Both describe their own workforce, measured with their own instrument.
What is a good employee survey response rate?
Both national surveys report their own and both were falling: 59% in the Civil Service, down from 61%, and 49% in the NHS, down from 51%. At smaller scale a higher rate is achievable. Track the direction of your own rate, because a fall usually means people doubt that anything follows.
Is there a UK benchmark for employee net promoter score?
No official source publishes one. Circulating figures come from commercial panels whose composition is usually undisclosed. Use the question to track your own trend rather than to compare yourself with others.
What percentage of UK employees are disengaged?
No official statistic says. Neither national survey classifies people as engaged or disengaged, because both report a score rather than a headcount. Widely quoted percentages come from commercial global research with its own definitions.
How often should you run an engagement survey?
Often enough to see change and rarely enough to act between rounds. Annual with a short pulse in between suits most organisations. Running a survey before anything has been done about the last one reduces the response rate and the trust behind it.
Your next step: make your own series comparable
- Write down the exact questions that produced your current score, and freeze them.
- Recalculate the last three years on those questions only, and discard any comparison with an external benchmark built from different ones.
- Publish the distribution and the response rate alongside the mean.
- Pick the largest gap between two teams and go and find out why.
For the questions themselves and how to act on the answers, read our post on the workplace engagement survey, or read and download our employee engagement guide. The guide is free to read, and the PDF uses our short download form.
Want to see what is behind the score before the next survey? Book a New Dynamics demo and bring last year's results. You can also email contact@new-dynamics.com.