TL;DR
- The employee turnover formula is leavers divided by employees, times 100. The numerator and the denominator are both choices, and the same 26 leavers can produce 12.2%, 13.0%, 14.4% or 14.8% depending on which you pick.
- Attrition and turnover are used interchangeably in the UK, and some employers reserve attrition for losses they do not replace. No authority settles it, so state your definition beside the number.
- Annualising a month by multiplying by twelve overstates turnover in any business with a season. Use a rolling twelve-month total, and write down what counts as a leaver before you count anything.
Two HR directors compare notes. One reports staff turnover of 13%, the other 14.4%. They assume they are looking at two different workforces. They are not. They are looking at the same 26 leavers, divided by two different numbers.
Almost every argument about a turnover figure is really an argument about arithmetic that nobody wrote down. This article sets out the employee turnover calculation in full: the formula, the three denominators in common use with one worked example run through all of them, how attrition differs from turnover in practice, how to annualise a quarterly or monthly figure without inflating it, what counts as a leaver, and a checklist you can apply to your own data this afternoon.
A rate tells you how many people went. It does not tell you why, and by the time it moves the people are gone. See how New Dynamics continuous feedback keeps the reasons visible while they are still here.
For the four cuts to apply to the finished number and the six kinds of cost behind it, our post on the turnover rate does that half of the job.
The formula, and the part of it that is not fixed
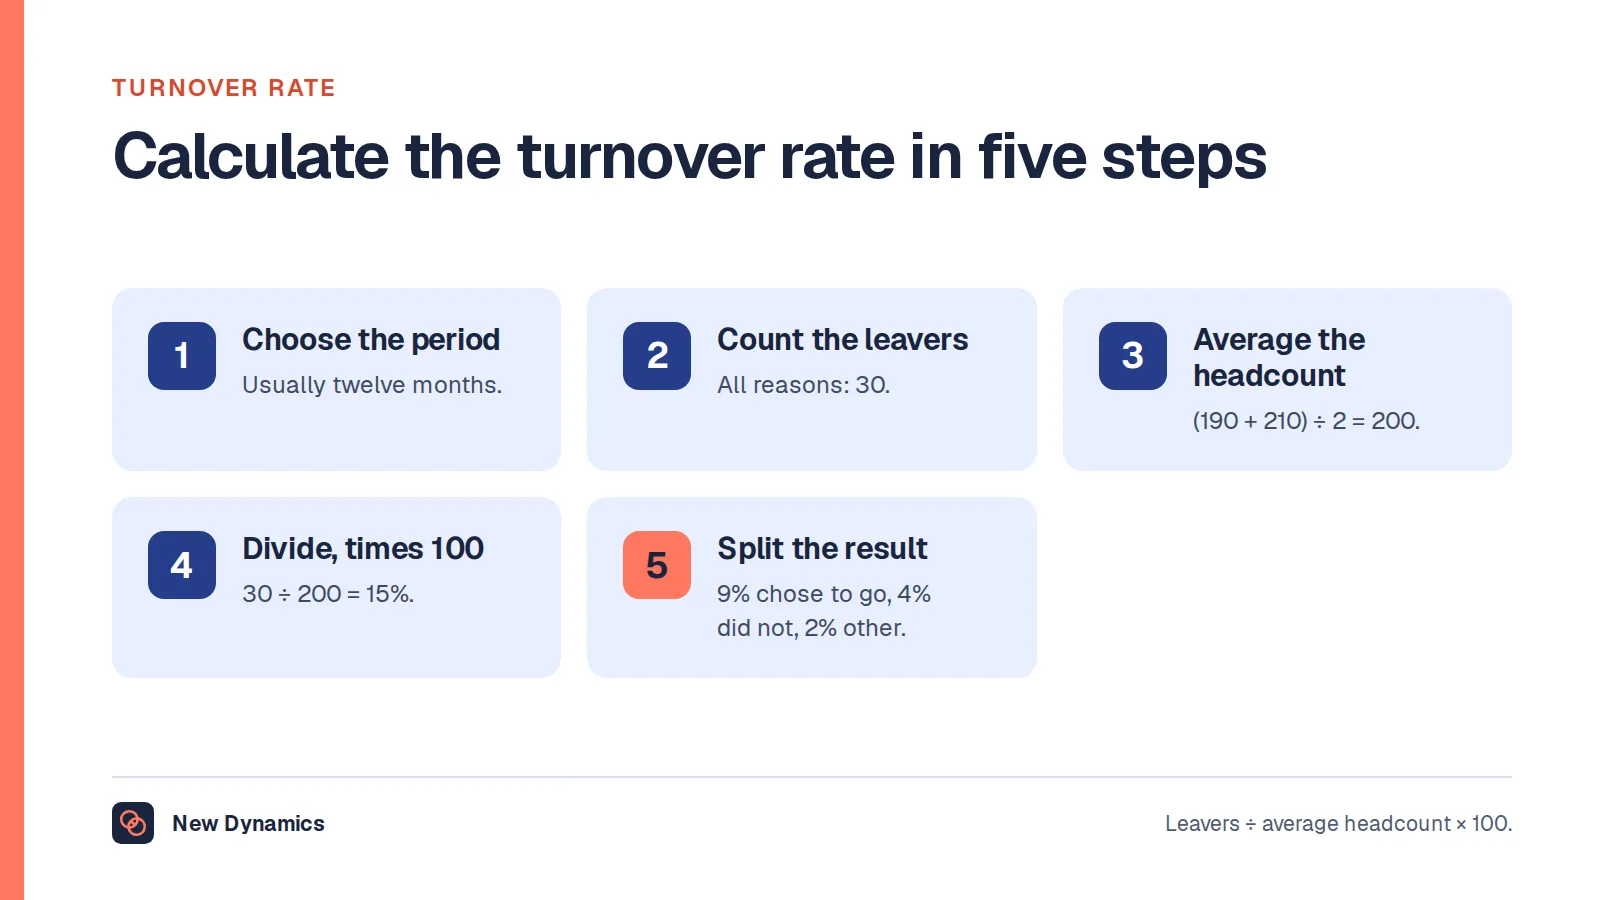
Turnover rate = (leavers in the period ÷ employees in the period) × 100
Every version of the employee turnover formula you will find is this sum. Staff turnover formula, employees turnover formula, attrition formula, rate of attrition formula: the same arithmetic under different labels. The percentage is not where organisations differ.
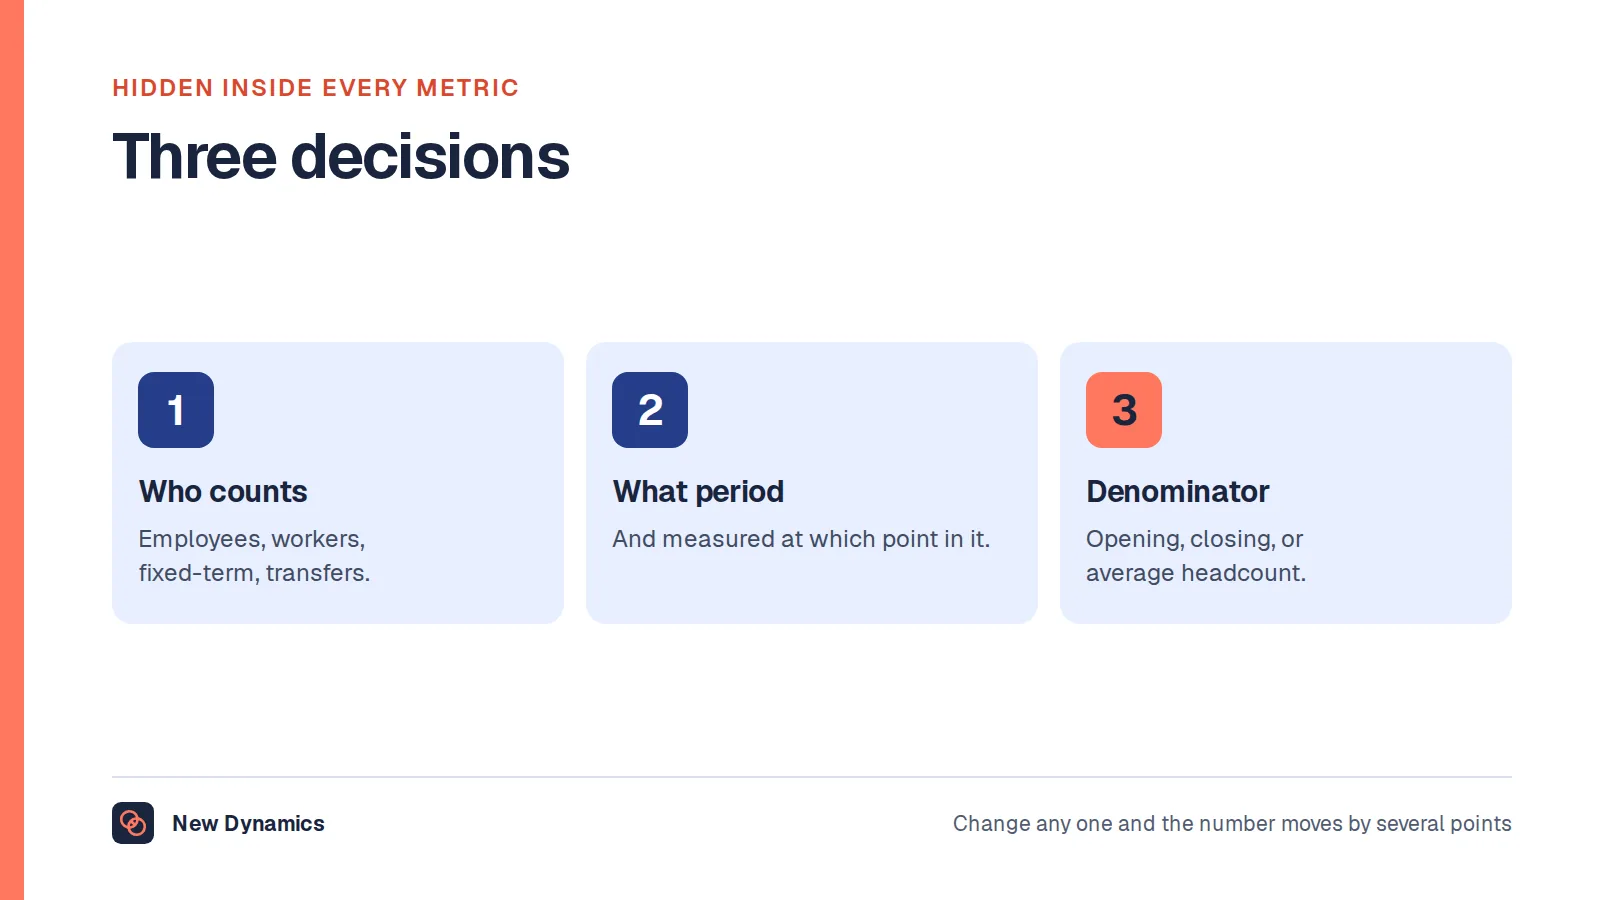
They differ on three things the formula does not specify.
- The period. A year, a quarter, a month, or a rolling twelve months.
- The numerator. Which endings of employment count as a leaver.
- The denominator. Which measure of "employees in the period" you divide by.
Get those three agreed and your turnover calculation is reproducible. Leave any of them implicit and your own figure will not be comparable with last year's, let alone with anybody else's. Our post on HR metrics makes the same case for the wider dashboard.
Three denominators, one worked example
Here is the example this article uses throughout. It is an example, not a benchmark, and the figures are made up for the arithmetic.
A company has 180 employees on 1 January and 220 on 31 December. During the year, 26 people leave. Many of its staff are part time: its average full-time equivalent count over the year is 176, and the 26 leavers between them amount to 21.5 full-time equivalents.
Denominator one: average headcount
The usual choice, and the one most published methods use. Take the opening headcount plus the closing headcount, divided by two.
- Average headcount = (180 + 220) ÷ 2 = 200
- Turnover rate = 26 ÷ 200 × 100 = 13.0%
One refinement matters in a business that grows or shrinks unevenly. A two-point average assumes the headcount moved in a straight line between January and December. If most of the hiring happened in November, the true average was lower than 200 all year, and 13.0% understates the turnover. Averaging the twelve month-end headcounts fixes this. In our example, if the twelve month-end figures average 192 rather than 200, the rate becomes 26 ÷ 192 × 100 = 13.5%.
Denominator two: opening headcount
Some employers divide by the headcount at the start of the period instead. It is simpler, it is stable once the period begins, and it is the denominator the retention rate uses, which makes the two measures line up.
- Turnover rate = 26 ÷ 180 × 100 = 14.4%
The weakness is predictable. In a growing organisation, opening headcount is the smallest plausible denominator, so it produces the highest rate. In a shrinking one it does the opposite and flatters the figure. If you choose it, choose it for a reason and keep it.
Denominator three: full-time equivalents
Where a large share of the workforce is part time, headcount overstates the amount of labour involved. A full-time equivalent count divides hours worked by standard full-time hours, so two people on half a week count as one.
Official statistics do this routinely. The Office for National Statistics publishes public sector employment with "full-time equivalent estimates (based on the number of hours worked divided by the standard full-time hours)" alongside headcount, in a release covering June 2026 and published on 15 September 2026. Civil Service Statistics 2026 reports both for the same population: 557,825 headcount and 523,795 on a full-time equivalent basis as at 31 March 2026.
If you use full-time equivalents in the denominator, you must use them in the numerator too.
- Done properly: 21.5 ÷ 176 × 100 = 12.2%
- Done carelessly, counting leavers as heads but employees as full-time equivalents: 26 ÷ 176 × 100 = 14.8%
That last line is the single most common error in a turnover calculation, and it is invisible in the output. It just looks like a slightly worse year.

So the same 26 leavers give 12.2%, 13.0%, 13.5%, 14.4% or 14.8%. The spread is 2.6 percentage points, which is larger than most of the year-on-year movements anybody reports. None of the five is wrong. Four of them are simply not the one you used last year.
Attrition formula or turnover formula?
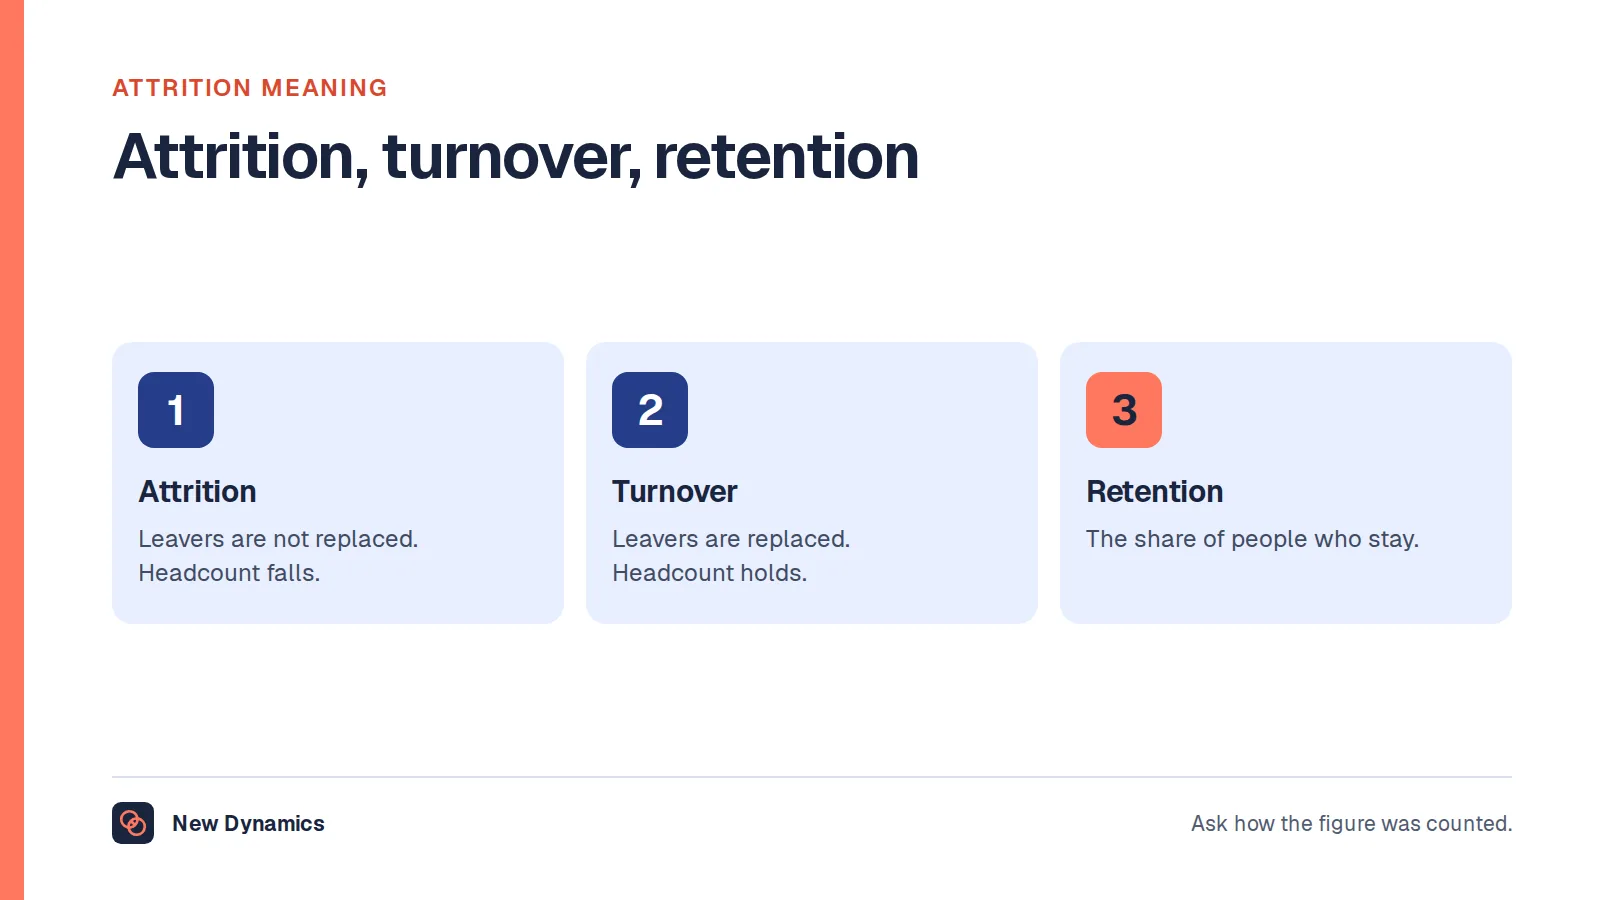
Search for the attrition formula and you will get the turnover formula. That is not sloppiness on the publishers' part, because in UK practice the two words are used interchangeably, and the arithmetic genuinely is the same.
There are two honest things to say about the difference.
In its strict sense, attrition means losses you do not replace. Headcount falls because the vacancy is closed rather than filled. That is the sense in "we will reduce headcount through attrition", and British English has an older phrase for it, natural wastage. Our post on the meaning of attrition sets out that definition and where it comes from.
In everyday use, most people mean turnover. Board papers, HR systems and software dashboards all say "attrition rate" for leavers divided by employees, with no implication about whether anyone was replaced.
No standards body settles this, so arguing about which usage is correct is a waste of a meeting. Three practical rules get you through it.
- State your definition in one sentence beside the number. "Attrition rate: all employment endings in the twelve months to 31 March, divided by average headcount."
- If you mean unreplaced losses, say so and show the headcount. A 5% attrition rate that shrinks the workforce and a 5% rate where every post was refilled are different events, and the headcount line is what distinguishes them.
- Never mix the two in one report. If the executive summary uses attrition loosely and the appendix uses it strictly, your reader will reconcile the two incorrectly.
Annualising a quarterly or monthly figure
You rarely want to wait a year. Three ways to get an annual figure from part-year data, in increasing order of reliability.
Scale up a part period. Nine leavers in seven months from an average headcount of 150 is 9 ÷ 150 × 100 = 6.0% for the period. Multiply by 12 ÷ 7 to annualise: 6.0 × 1.714 = 10.3%.
Multiply a quarter by four. Five leavers in the first quarter from an average headcount of 200 is 2.5%, which annualises to 10.0%.
Multiply a month by twelve. Three leavers in March from an average headcount of 200 is 1.5%, which annualises to 18.0%.
Each of those is an estimate that assumes the rest of the year looks like the part you measured. In a business with any seasonal pattern, that assumption fails hard. A hotel, a retailer, a farm or a visitor attraction loses a block of seasonal staff in one or two predictable months. Annualise September and you will publish a crisis. Annualise February and you will publish a success. Neither is the year.
This is not a quirk of HR data. It is why national statisticians seasonally adjust almost everything. The ONS explains that the purpose of seasonal adjustment "is to remove systematic calendar-related variation associated with the time of the year, that is, seasonal effects. This facilitates comparisons between consecutive time periods." Without it, as the same guidance puts it, short-term effects associated with the time of the year "obscure or confound other movements".
You cannot seasonally adjust a series of three data points, and you do not need to. Use a rolling twelve-month total instead: leavers in the last twelve months divided by average headcount over the same twelve months, recalculated every month. Every month of the year is always in the window, so the seasonal peak cannot distort it, and the figure still moves monthly so you can see a trend forming. If you report one turnover number to a board, report this one.

Two smaller notes. A short-period rate multiplied up is not a compounded rate, so do not treat 1.5% a month as a prediction that 18% of today's named employees will go. And always label the period on the face of the number: "2.5% (quarter to 31 March)" cannot be misread, while "2.5%" invites someone to compare it with an annual figure.
What counts as a leaver
This is where two organisations with identical experience part company, and it is decided entirely by definition rather than by arithmetic. Each of the following is counted by some employers and excluded by others.
- Resignations. Included everywhere. This is the only universal case.
- Dismissals. Almost always included, sometimes reported separately as involuntary turnover.
- Redundancies. Frequently excluded, on the argument that a restructure is not a retention problem. Excluding them makes a bad year look calm.
- End of a fixed-term contract. Often excluded as a planned ending, though a contract that was expected to be renewed and was not is a real loss.
- Internal transfers and promotions. Turnover for the department, not for the organisation. Which one you are reporting on decides this, and group companies have to decide whether a move between legal entities counts.
- Retirements. Included by most definitions, excluded by some as unavoidable. They are also the most predictable leavers you have, which is an argument for counting them and planning for them.
- Deaths in service and ill-health exits. Technically employment endings. Many employers exclude them, and most say nothing about having done so.
- Probation failures. Included, and worth reporting separately, because they point at recruitment rather than retention.
- TUPE transfers. A whole team moving out with an outsourced service can double a reported rate. Disclose it or exclude it, but do not let it sit silently in the total.
- Agency and contract workers. Usually outside the employee population entirely. If they are a third of the people on site, say which population the rate covers.
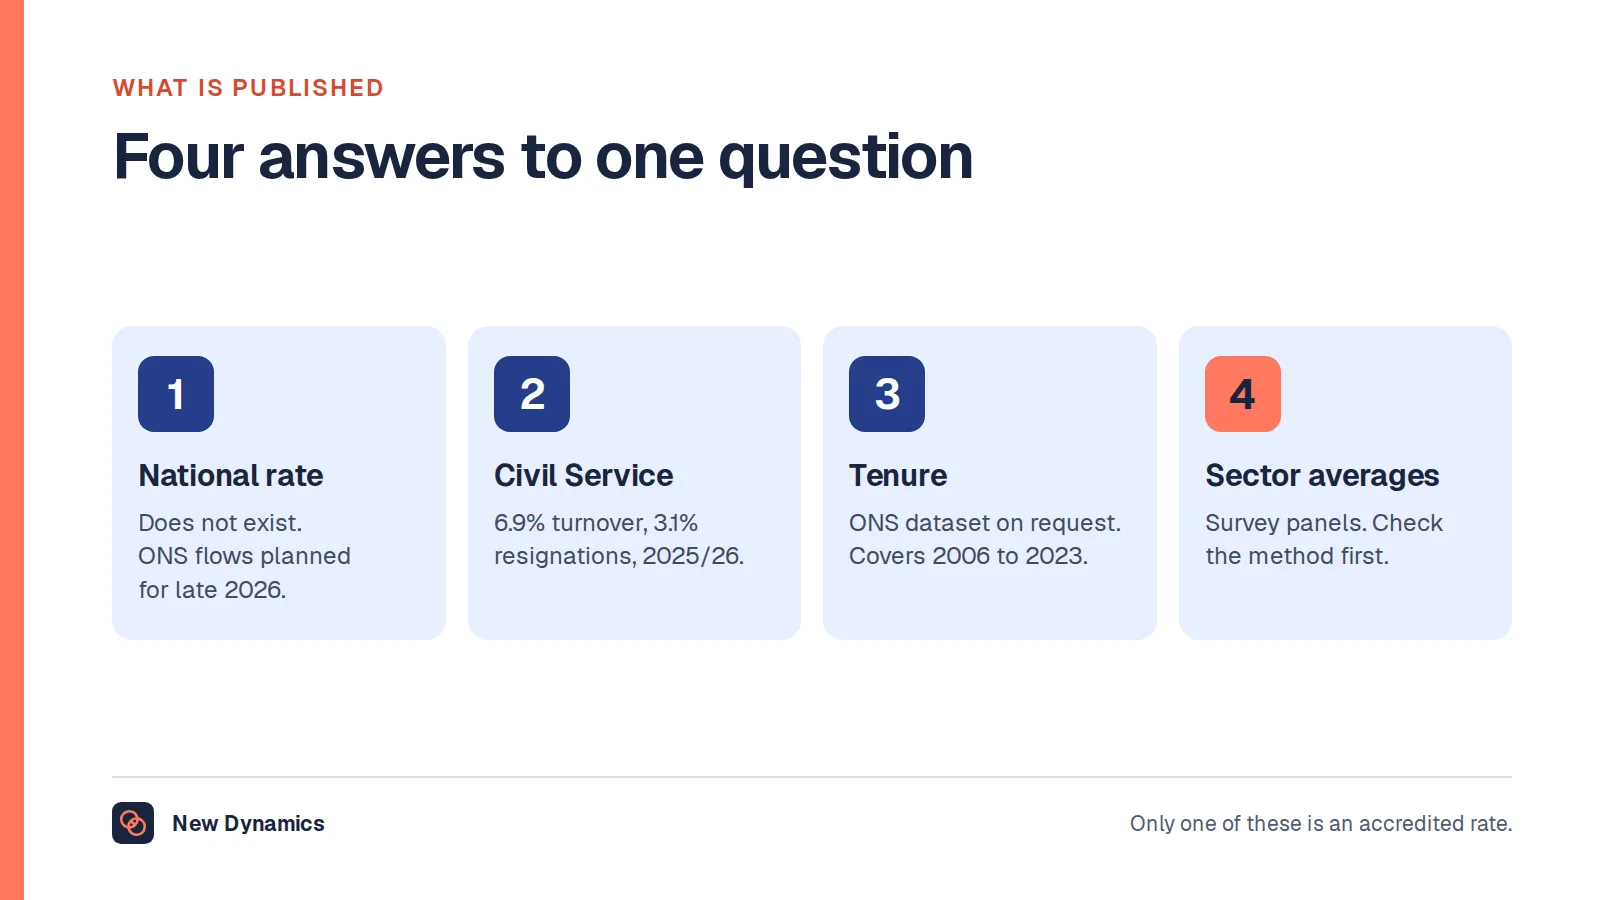
Published statistics face exactly the same question and answer it in the open. Civil Service Statistics 2026 states its rule plainly: "Turnover rate includes all moves out of the Civil Service over each year to 31 March." On that wording a move between two departments does not count, because the person has not moved out of the Civil Service. One sentence, and the number becomes checkable.
Why two rates from the same organisation differ
The clearest published demonstration of everything above comes from a single bulletin. Civil Service Statistics 2026, measured as at 31 March 2026, reports two rates for the same workforce in the same year: "The turnover rate in the Civil Service fell to 6.9% from 7.1% in 2024/25. The resignation rate fell to 3.1% from 3.6% in 2024/25."
Nothing has changed between those two figures except the numerator. One counts everybody who left. The other counts only the people who chose to go. The gap between 6.9% and 3.1% is the entire reason a turnover rate quoted without its definition is worthless, and the reason the same organisation can honestly describe itself as having 6.9% turnover or 3.1% turnover depending on which question it was asked.
Copy the structure rather than the numbers. Two rates side by side, each labelled, each with its period, is a better report than one number with a target next to it. For what is and is not published nationally, and why most sector averages cannot be compared with yours, see our post on the UK employee turnover rate. The wider picture sits on our HR statistics hub.
A checklist for your own data
Work through these in order before you quote a figure to anyone.
- Fix the period and put it on the face of the number. Prefer a rolling twelve-month window for reporting.
- Write the leaver rule in one sentence, naming your treatment of redundancies, fixed-term endings, internal transfers, retirements and deaths in service.
- Choose one denominator and record it: average headcount, opening headcount or full-time equivalents.
- Check the two halves match. Heads over heads, or full-time equivalents over full-time equivalents. Never one of each.
- Recalculate the last three years on the single definition you have just written, not on whatever each year used at the time.
- Publish the definition beside the number, every time, in the same words.
- Split it into voluntary, involuntary and first-year turnover before you draw any conclusion, and show counts as well as percentages where a team is small.

Step five is the one people skip, and it is the one that pays. Most organisations discover at that point that their trend was partly a change of method, and a turnover line that fell two points because somebody stopped counting fixed-term endings is worse than no line at all.
Frequently asked questions
How do you calculate the employee turnover rate?
Divide the number of leavers in the period by the number of employees in the period, and multiply by 100. For example, 26 leavers from an average headcount of 200 gives a turnover rate of 13.0%. The arithmetic is simple; the choices about which leavers to count and which headcount to divide by are what you need to record.
What is the attrition formula?
The same sum: leavers in the period divided by employees in the period, times 100. In UK practice attrition rate and turnover rate are usually calculated identically, so the formula does not tell you which definition the publisher had in mind.
Is attrition the same as turnover?
In everyday use, yes. In its strict sense, attrition means losses the employer does not replace, so headcount falls, while turnover means leavers who are replaced. No standards body settles which usage is correct, so state your own definition beside the number and show the headcount if you mean the strict sense.
How do you calculate annual staff turnover from a monthly figure?
Multiplying one month by twelve gives a rough annual estimate, but it assumes every month looks like the one you measured. In a seasonal business that overstates or understates the year badly. A rolling twelve-month total, recalculated monthly, always contains every season and is the figure to report.
Should the denominator be average headcount or full-time equivalents?
Average headcount is the usual choice and the one most published methods use. Full-time equivalents are better where much of the workforce is part time, because they measure labour rather than people. Whichever you choose, use the same basis in the numerator, since counting leavers as heads and employees as full-time equivalents inflates the rate.
What counts as a leaver in a turnover calculation?
Resignations always. Dismissals almost always. Redundancies, fixed-term endings, internal transfers, retirements, deaths in service and TUPE transfers are each included by some definitions and excluded by others, which is why two employers with identical experience can report rates several points apart.
Your next step: write the sum down, then run it
- Write your leaver rule and your denominator in two sentences, and get them agreed by whoever presents the number.
- Recalculate the last three years on that single definition.
- Switch your reporting to a rolling twelve-month window.
- Split the result into voluntary, involuntary and first-year turnover, and take the biggest unexplained department to its manager.
For the work that sits behind the number, read and download our employee retention guide. The guide is free to read, and the PDF uses our short download form.
Want leaver data, one-to-ones and the reasons behind both in one place? Book a New Dynamics demo and bring last year's leaver list. You can also email contact@new-dynamics.com.