TL;DR
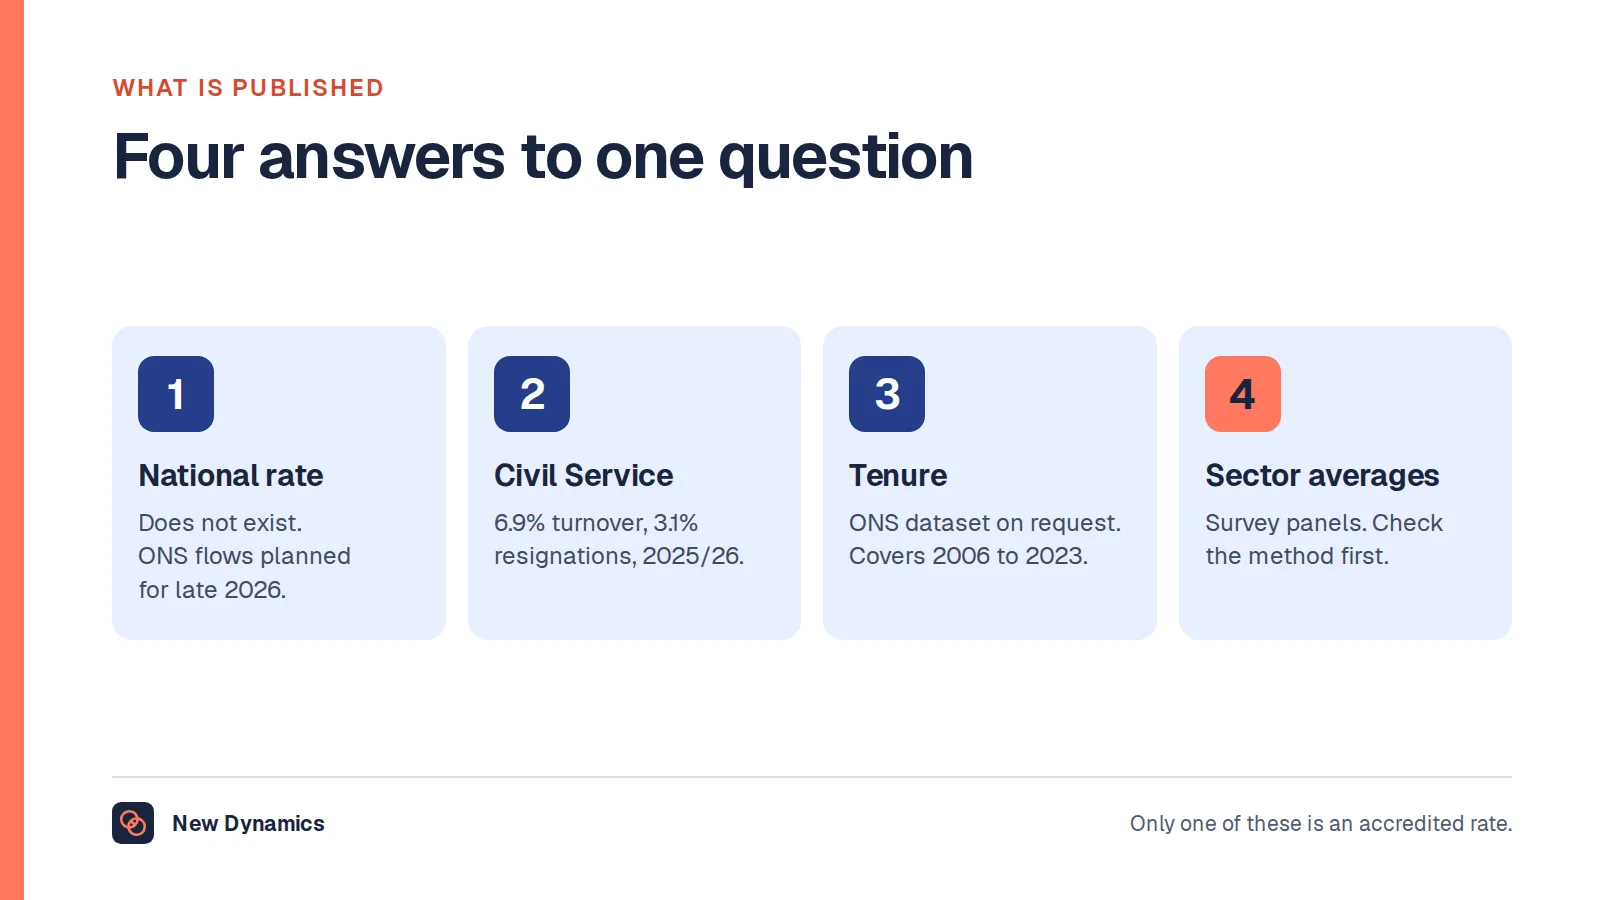
- No official UK statistic publishes an HR to employee ratio. The ratios in circulation come from membership and vendor panels whose composition is usually undisclosed, so they cannot be checked against your own figures.
- One sourced HR headcount share does exist. Civil Service Statistics 2026 reports 12,890 civil servants in the Human Resources profession out of a headcount of 557,825 as at 31 March 2026, which works out at roughly one HR post per 43 people.
- The same spreadsheet shows the ratio varying from about one per 8 to about one per 86 between departments on one date and one definition. That spread is the argument against using a ratio to size a team at all.
Somebody on the board asks what the HR to employee ratio should be. The question sounds settled, as though a national figure exists and your job is to measure the gap. It does not exist. What exists is one genuinely sourced HR headcount share for a very large employer, a national count of people working in HR occupations, and a long tail of round-number rules of thumb with no visible method behind them.
This article sets out what is actually published, what it does and does not tell you, and how to size an HR team from the work in front of it rather than from somebody else's panel.
Most of the case for a given HR headcount rests on how much of the routine work still needs a person. See how New Dynamics workflows take the chasing, reminders and sign-offs off a coordinator's desk before you argue about a ratio.
For the figure most often quoted alongside it, our post on revenue per employee covers the same discipline applied to a different denominator.
There is no official HR to employee ratio
No part of the UK statistical system publishes one. The Office for National Statistics measures employment, occupations, earnings and hours. It does not measure how many HR staff an organisation employs per head, because that is an internal organisational structure rather than a labour market quantity. No government department publishes a target or an average either.
That leaves the ratios you will find in a search. Almost all of them come from membership surveys or vendor panels. The problem is not that a panel is worthless. The problem is that the composition is usually undisclosed, so three things you need are missing.
You do not know who was in the sample, which means you cannot tell whether it resembles your sector, your size or your geography. You do not know what counted as HR, which means recruiters, payroll, learning, reward, HR systems and shared service agents may be in or out. You do not know what counted as an employee, which means contractors, agency workers, seasonal staff and group companies may be in the denominator or not.
A ratio whose numerator and denominator are both undefined is not a benchmark. It is a number with a logo on it. Our HR statistics hub keeps the figures that can actually be sourced in one place for the same reason.
The one HR headcount share you can quote
There is a real exception, and it is large. Civil Service Statistics 2026, published on 28 October 2026 and measured as at 31 March 2026, reports that "Civil Service headcount stands at 557,825 as at 31 March 2026."
The accompanying statistical tables break that headcount down by profession. Table 8, "Civil Service employment; profession by government department, as at 31 March 2026", records 12,890 civil servants in the Human Resources profession. That is 2.3% of the whole Civil Service, which is roughly one HR post for every 43 people.
Table D1 does the same job with a different classification. It records 12,015 civil servants in the People function, which is about one per 46. Same employer, same date, same spreadsheet, two defensible definitions, two different answers. That gap of three people in the denominator is the whole argument in miniature.

Then look inside the total, because that is where the figure stops being comforting.
| Employer group | HR profession posts | Total headcount | Roughly one HR post per |
|---|---|---|---|
| Cabinet Office | 1,325 | 10,235 | 8 |
| Ministry of Defence | 1,360 | 56,915 | 42 |
| Department for Work and Pensions | 1,990 | 96,930 | 49 |
| Department for Education | 135 | 8,090 | 60 |
| HM Revenue and Customs | 1,135 | 75,500 | 67 |
| Ministry of Justice | 1,460 | 97,505 | 67 |
| Home Office | 600 | 51,470 | 86 |
Those ratios are more than ten times apart. They were measured on one date, by one publisher, using one definition, inside one employer. Nothing about sector, country or year explains the spread. Structure does. The Cabinet Office hosts cross-government people work that other departments consume, so its HR posts serve a population far larger than its own payroll. A department that has pushed transactional work into a shared service reports a thinner ratio without having less HR done for it.
Two caveats belong next to the numbers. The tables note that "Numbers are rounded to the nearest five", and that "Professions relate to the post occupied by the person and are not dependent on qualifications the individual may have." The bulletin also records that "The reporting rate for professions data is 98.0%, up from 97.4% in 2025", while the response rate for function information "has increased from 91.2% in 2025 to 94.4% in 2026". So the share is close to complete but not total.
Take the structure and the method. Leave the number. It describes the Civil Service, and quoting it as a UK ratio or a private sector ratio is the mistake this article exists to prevent.
How many people work in HR across the UK
The second sourced anchor is national, and it answers a different question. The ONS release "Employment by 4-digit occupation and 2-digit industry codes, UK, 2011 to 2025", released on 19 March 2026, gives "Estimates of employment by 4-digit Standard Occupational Classification (SOC) code and 2-digit Standard Industrial Classification (SIC) code, drawn from the Annual Population Survey."
For January to December 2025, three SOC 2020 unit groups cover HR work:
- 1136 Human resource managers and directors: 237,989
- 3571 Human resources and industrial relations officers: 199,338
- 4136 Human resources administrative occupations: 63,859
That is 501,186 people, against a total of 33,169,613 in employment on the same sheet. HR occupations are therefore about 1.5% of everyone in work in the UK, or about one person in 66.
Read that carefully, because it is not an HR to employee ratio. It counts people whose main job is an HR job, wherever they work, including consultancies and recruitment firms selling HR work to other organisations. It is a survey estimate with sampling error, not an administrative count. And it says nothing about how those people are distributed between a 40-person charity and a 40,000-person retailer. What it is good for is sanity checking: if a vendor claims HR is a vanishingly small profession or an enormous one, this is the published answer.
What actually drives the number
Once you accept that no ratio can be imported, the useful question becomes what makes one organisation need more HR capacity than another of the same size.

Case load, not headcount. HR capacity is consumed by cases: grievances, disciplinaries, absence management, capability processes, flexible working requests, family leave, redundancy consultation and tribunal claims. Case volume does not scale neatly with headcount. External pressure is real and measurable. The Ministry of Justice release Tribunal Statistics Quarterly: April to June 2026, published on 20 October 2026, reports that "Single Employment Tribunal (ET) receipts increased by 28%, disposals decreased by 6% and open caseload also increased by 51% over the same period as receipts have continued to exceed disposals over the last year." The same release records that "In Q1 2026, the Employment Tribunal received 14,000 single claim receipts and disposed of 6,100 single claim cases", and that "There were 70,000 single claim cases in the open caseload at the end of June." A case that takes longer to resolve occupies your people for longer, whatever your headcount does.
Number of sites and shift patterns. Twenty sites is not one site twenty times over. Multiple locations multiply local relationships, local managers who need coaching, local consultation arrangements and travel. Shift and seasonal work multiply starters, leavers, rota changes and pay queries per head.
How much is genuinely self-service. The single biggest swing factor is who performs routine transactions. If an employee can change their own bank details, book their own leave and download their own payslip, and if a manager can run an absence conversation from a prompt without a coordinator, the same HR team supports far more people. If every change arrives as an email to a shared inbox, it cannot.
Whether payroll, recruitment and learning sit inside HR. This changes the ratio without changing a single piece of work. An organisation with payroll inside HR will always look HR-heavy against one that reports payroll under finance. The ONS occupation data makes the point: "4122 Book-keepers, payroll managers and wages clerks" is counted separately from the three HR unit groups, with 381,937 people in it for January to December 2025. Where you draw the line decides your ratio.
Pace of change. A restructure, an acquisition, a new pay framework or a systems migration is a project, not business as usual. Sizing a permanent team against a year that contained one of those builds the project into your baseline for good.
HR budget per employee: what you can and cannot source
No official UK statistic publishes HR cost per employee. Any figure presented as one comes from a panel, and the three unanswered questions from earlier apply to it twice over, because cost definitions vary even more than headcount definitions.
What you can do is build the number from published inputs and your own arithmetic. The Civil Service tables give the salary side. Table 35 reports a median salary of 43,130 pounds for the Human Resources profession as at 31 March 2026, with a lower quartile of 35,460 and an upper quartile of 57,950, against 37,820 pounds for all professions. The notes state that "Salaries represent actual annual gross salaries rounded to the nearest ten."
Put the two published figures together and 12,890 HR posts at the HR median salary comes to roughly 1,000 pounds of HR salary per civil servant per year. That is arithmetic on two sourced numbers, not a benchmark, and it is deliberately incomplete. It uses a median rather than the actual pay bill, and it excludes employer pension and national insurance, HR systems, external legal and occupational health advice, recruitment fees, agency cover and the cost of manager time spent on people work.
For your own organisation, build it the same way and say what is in it. List the HR salary bill, the employer costs on top, the software, the external advice and the recruitment spend. Divide by average headcount for the year. Publish the line items with the number. A cost per employee whose contents are written down is comparable with your own previous years, which is the only comparison that holds.
What to measure instead of a ratio

A ratio is an output of decisions you have already made. These are inputs you can act on.
Volume of work, counted monthly. Open cases by type. Starters, leavers and internal moves. Contract and pay changes. Policy queries. Count them for three months before you argue about headcount, because almost nobody knows their real numbers.
Time to resolve, not time spent. Days from a request arriving to it being closed, split by type. A long queue with a thin team and a long queue with a thick team are different problems and need different fixes.
Share of work that is manual. How many steps in your top five processes need a person only because nothing is automating them. That share is the honest size of your efficiency argument, and reducing it is usually cheaper than a new post.
Manager self-sufficiency. What proportion of people conversations happen without HR in the room. This is the lever that moves capacity most and the one least often measured. Our strategic workforce planning post covers how that feeds a longer-range plan.
Specialist coverage. A ratio cannot tell you whether you have reward, employee relations and systems expertise. A team of generalists at an enviable ratio can still be unable to run a pay review.
Your own trend. Your HR headcount per 100 employees over three years, counted the same way each year, with a note of what changed. That is a benchmark you can defend because you can explain every movement in it.
What usually goes wrong
- Importing a round number, then discovering that it included recruiters and yours does not.
- Changing what counts as HR between years, which turns a trend into noise.
- Sizing against a year that contained a restructure, which bakes a project into the baseline.
- Comparing a shared service model with an embedded one, which measures structure and calls it efficiency.
- Cutting to a ratio before reducing the work, which moves the queue rather than the cost.
- Quoting a public sector share as a national average, which is the most common misuse of the one sourced figure available.
Frequently asked questions
Is there an official UK HR to employee ratio?
No. No ONS or government release publishes an HR to employee ratio, because it describes internal organisational structure rather than a labour market quantity. The ratios in circulation come from membership and vendor panels whose composition is usually undisclosed, so they cannot be checked.
What is a good HR to employee ratio?
There is no defensible universal answer. Civil Service Statistics 2026 shows the ratio ranging from roughly one HR post per 8 people to roughly one per 86 between departments, on one date and one definition. If the spread is that wide inside a single employer, an external average cannot tell you your right number.
How many HR staff per employee does the Civil Service have?
Civil Service Statistics 2026 reports 12,890 civil servants in the Human Resources profession out of a headcount of 557,825 as at 31 March 2026. That is 2.3% of the workforce, or roughly one HR post per 43 people. Classified by function instead, 12,015 sit in the People function, which is about one per 46.
How many people work in HR in the UK?
ONS Annual Population Survey estimates for January to December 2025 count 237,989 human resource managers and directors, 199,338 human resources and industrial relations officers and 63,859 people in human resources administrative occupations. That is 501,186 people, about 1.5% of the 33,169,613 in employment.
What is a reasonable HR budget per employee?
No official UK source publishes one. Build your own instead: HR salaries, employer pension and national insurance, software, external advice and recruitment spend, divided by average headcount, with the line items listed beside the figure. Compared with your own previous years, that number means something.
Does payroll count in the HR headcount?
It depends entirely on where payroll reports, which is why ratios are so hard to compare. The ONS counts book-keepers, payroll managers and wages clerks as a separate occupation group from the three HR groups. Decide your own boundary, write it down, and apply it the same way every year.
Your next step: count the work before you argue the number
- Write down what counts as HR for you, naming payroll, recruitment, learning and HR systems as in or out.
- Count three months of real volume: open cases by type, starters, leavers, moves and pay changes.
- Measure days from request to resolution for your five most common requests.
- Mark every step in those five processes that needs a person only because nothing is automating it.
- Take the list, not a ratio, to the conversation about headcount.
For the wider framework that this sits inside, read and download our human resources management guide. The guide is free to read, and the PDF uses our short download form.
Want to see how much of that manual share a workflow can absorb? Book a New Dynamics demo and bring last month's shared inbox. You can also email contact@new-dynamics.com.