TL;DR
- The best published UK figures come from the NHS Staff Survey, answered by 766,285 people. In 2025, 86.42% said they had an appraisal or review in the last 12 months, a five-year high, up from 79.93% in 2021.
- Coverage is not quality. Of those, only 26.01% say their appraisal definitely helped them improve how they do their job, 35.32% that it definitely helped them agree clear objectives, and 32.86% that it definitely left them feeling their work is valued.
- No official UK statistic exists for how many companies run annual reviews, for 360 feedback or forced ranking adoption, or for rating bias. The gap is worth knowing about rather than filling with a vendor survey.
Almost every statistic you will find about performance reviews comes from a vendor survey of its own customers. There is one large exception, it is published every year, it covers three quarters of a million people in the United Kingdom, and it tells an uncomfortable story.
This article sets out the figures that can actually be checked, what they mean, and which performance statistics nobody publishes at all.
Coverage is the easy part of a review cycle, and quality is the part that decides whether it was worth doing. See how New Dynamics performance reviews build the conversation from evidence gathered through the year.
For the process behind the numbers, our post on the performance appraisal covers how a cycle should run.
The one large published UK source
The NHS Staff Survey is answered by hundreds of thousands of people and reports appraisal separately from everything else. The 2025 national results briefing, published in March 2026, records a "49% response rate (down from 51% in 2024)" with 766,285 staff responding.
On coverage, it reports that "86.42% of staff say they have had an appraisal, annual review, development review, or Knowledge and Skills Framework development review in the last 12 months, which is a five-year high". The run of years is 79.93% in 2021, 81.31% in 2022, 83.56% in 2023, 85.44% in 2024 and 86.42% in 2025.
That is a real improvement, sustained over five years, in one of the largest employers in the world.
Coverage is not quality

The same briefing asks the people who had one what it did. The percentages saying their appraisal definitely helped are:
| What the appraisal did | 2025 | 2024 | 2021 |
|---|---|---|---|
| Helped them improve how they do their job | 26.01% | 26.04% | 20.41% |
| Helped them agree clear objectives | 35.32% | 35.53% | 30.95% |
| Left them feeling their work is valued | 32.86% | 33.41% | 29.80% |
Almost nine in ten people had a review. Around one in four say it definitely helped them do the job better. The overall Appraisals sub-score is 4.90 out of 10, against 4.88 in 2024 and 4.25 in 2021, which the briefing notes is "at its highest level for five years".
Two honest readings sit side by side. The trend is genuinely upward on every measure over five years. And a process that three quarters of people do not say definitely helped them is not yet doing the job it exists to do.
Read "definitely" carefully. These are the top-box answers, so the figures are not a verdict that the rest were useless. They are a measure of how many people were certain it helped, which is the standard worth holding a review to.
What the Civil Service adds
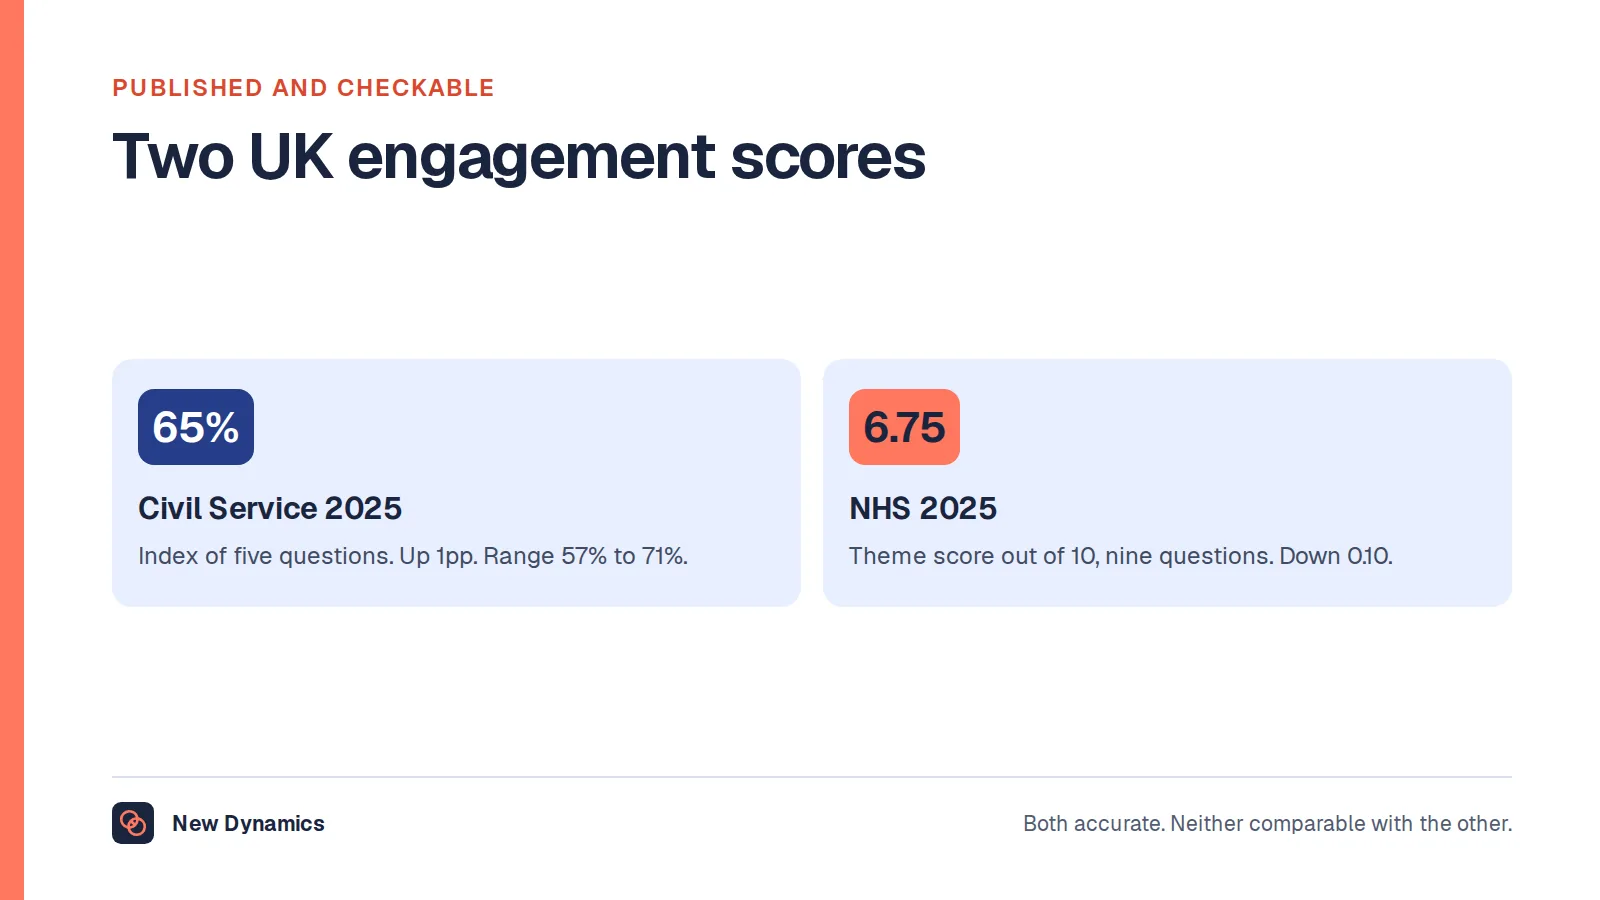
The Civil Service People Survey 2025, published on 28 May 2026 and answered by 343,961 people, does not report an appraisal theme. It does report learning and development, with that theme showing "the largest decrease (down 2pp)" of any theme compared with 2024.
Development is where most review conversations are supposed to land, so a falling development score alongside a rising appraisal completion rate elsewhere is a useful pairing. Completing the form and developing someone are different achievements.
What nobody publishes

Four of the most searched performance statistics have no official United Kingdom source at all.
How many companies run annual reviews. No official survey counts employer practice. Figures in circulation come from vendor and membership panels of self-selecting respondents, and they rarely state the sample.
360 feedback adoption. Not measured nationally. The figures you will find come from suppliers of 360 feedback.
Forced ranking. Not measured nationally either, and particularly unreliable in self-reported surveys, because few employers describe their own calibration as forced ranking.
Rating bias. No national statistic exists for differences in performance ratings between groups. This is the most important gap, because the data to measure it sits inside every employer that rates people.
Two more belong on the same list. How many employees get regular feedback is not measured nationally, and continuous performance management adoption is measured only by the people selling it. Both describe employer practice, which no United Kingdom official statistic counts.
For the figures the United Kingdom does publish on work, pay, absence and the workforce, our HR statistics hub collects them with the publisher and the period attached.
The statistics worth producing yourself

Every number below is available inside your own cycle, and none of them needs a benchmark to be useful.
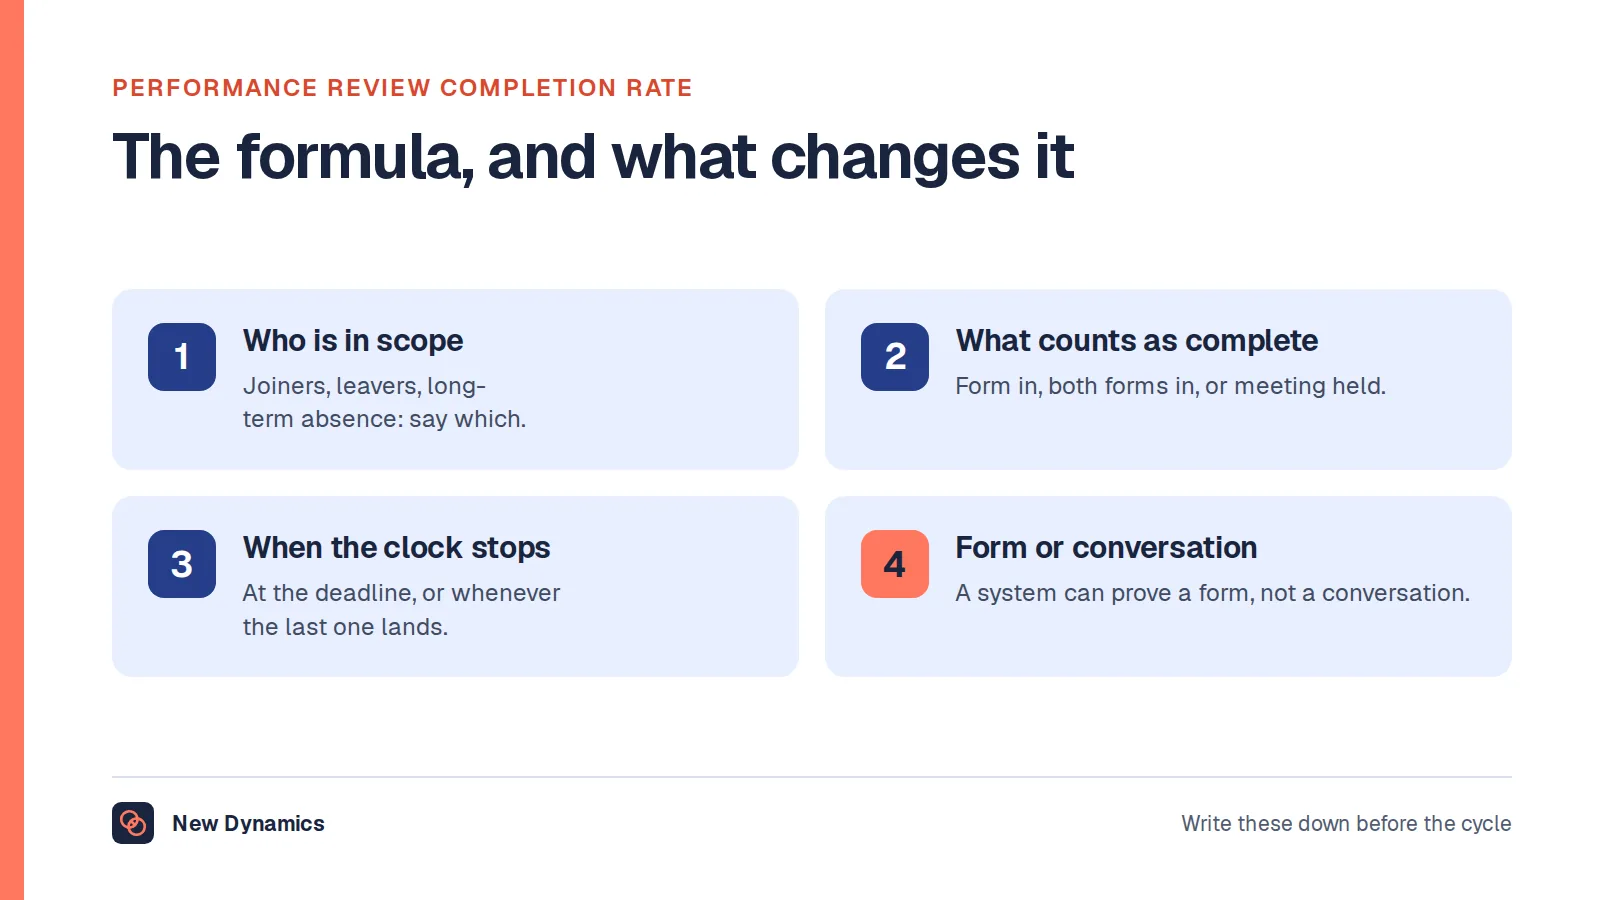
- Completion, by stage and by team. Where a cycle stalls is more informative than whether it finished, and our post on the performance review completion rate sets out how to measure it.
- The NHS question, asked of your own people. Did the review definitely help you improve, agree clear objectives, and feel your work is valued? Three questions, comparable year to year, and directly comparable with a published national figure.
- Rating distribution by group. By sex, ethnicity, age, disability, working pattern and length of service, wherever the numbers are large enough to protect anonymity. This is the bias statistic nobody publishes, and you can produce it.
- Time from review to development action. A review with no action is an administrative event.
- The proportion of reviews carrying evidence recorded before the final month, which separates a year-round process from an annual act of recollection.
What usually goes wrong
- Reporting completion as the result. Coverage of 86% with a quarter saying it helped is the warning this whole article exists to give.
- Quoting a vendor statistic without its sample, which is most performance statistics in circulation.
- Comparing your score with a benchmark built from different questions, covered in our post on the employee engagement benchmark.
- Never looking at ratings by group, which leaves the one bias measure you could produce unmeasured.
- Changing the questions each year, which ends the trend.
- Treating a five-year improvement as a finished job. The NHS figures are both genuinely better and not yet good.
Frequently asked questions
What percentage of employees get a performance review?
In the NHS, 86.42% of staff said they had an appraisal, annual review, development review or Knowledge and Skills Framework development review in the last 12 months in 2025, up from 79.93% in 2021. No equivalent figure is published for the United Kingdom as a whole.
Do performance reviews work, according to the statistics?
The most reliable UK evidence is mixed. In 2025, among NHS staff who had one, 26.01% said it definitely helped them improve how they do their job, 35.32% that it definitely helped them agree clear objectives, and 32.86% that it definitely left them feeling valued. All three are higher than in 2021, and all three leave most people short of a clear yes.
How many companies do annual performance reviews?
No official statistic says. Percentages in circulation come from vendor and membership surveys of self-selecting respondents, usually without a stated sample, so they describe the panel rather than the economy.
Are there UK statistics on 360 feedback or forced ranking?
No. Neither practice is measured in official statistics, and self-reported figures are unreliable, because employers rarely describe their own calibration as forced ranking.
What do the statistics say about performance review bias?
No national statistic measures differences in ratings between groups. The data exists inside employers rather than in any published series, so the only reliable answer is the one you produce from your own rating distribution, split by group where the numbers protect anonymity.
What is a good performance review completion rate?
Completion is the measure most organisations can reach and the one that says least about quality. Treat a high completion rate as the starting point, then ask the three questions about whether the review helped, and track those year to year.
Your next step: measure the thing that matters
- Take your completion rate for the last cycle and write it down. That is the easy number.
- Add the three NHS questions to your next survey, worded the same way, so you have a figure you can compare with a published one.
- Pull your rating distribution and split it by group, with a threshold that protects anonymity.
- Count how many reviews led to a development action inside a month.
For the process these numbers describe, read our post on the performance appraisal, or read and download our performance review guide. The guide is free to read, and the PDF uses our short download form.
Want reviews built from evidence rather than recollection? Book a New Dynamics demo and bring last cycle's completion report. You can also email contact@new-dynamics.com.