TL;DR
- The Employer Skills Survey 2024, published by the Department for Education and Skills England on 24 July 2025 and covering the whole UK, puts total employer training expenditure at £53.0 billion over the previous 12 months, equivalent to around £1,700 per person employed, down from around £1,960 in 2022.
- The same survey reports 111 million training days, equivalent to 5.7 days per person trained and 3.6 days per employee. No official UK series publishes training hours per employee, so days are the honest unit to quote.
- On skills, 12% of UK employers reported skills gaps and 4.0% of employees were judged by their employer not to be fully proficient, covering 1.26 million people. Both figures are the lowest in the series, and that is a fall in reported shortfalls, not proof of a better trained workforce.
Ask for the average training spend per employee in the UK and you will be handed a dozen numbers, most of them from suppliers of training. There is one large official survey that answers the question properly, it runs across all four nations, and it has been running since 2011.
This article sets out the figures that can actually be checked, the reference period and coverage of each, and which learning and development statistics nobody publishes at all.
Development only shows up in the figures when it is attached to something people are working towards. See how New Dynamics goals and OKRs keep development objectives visible next to the work.
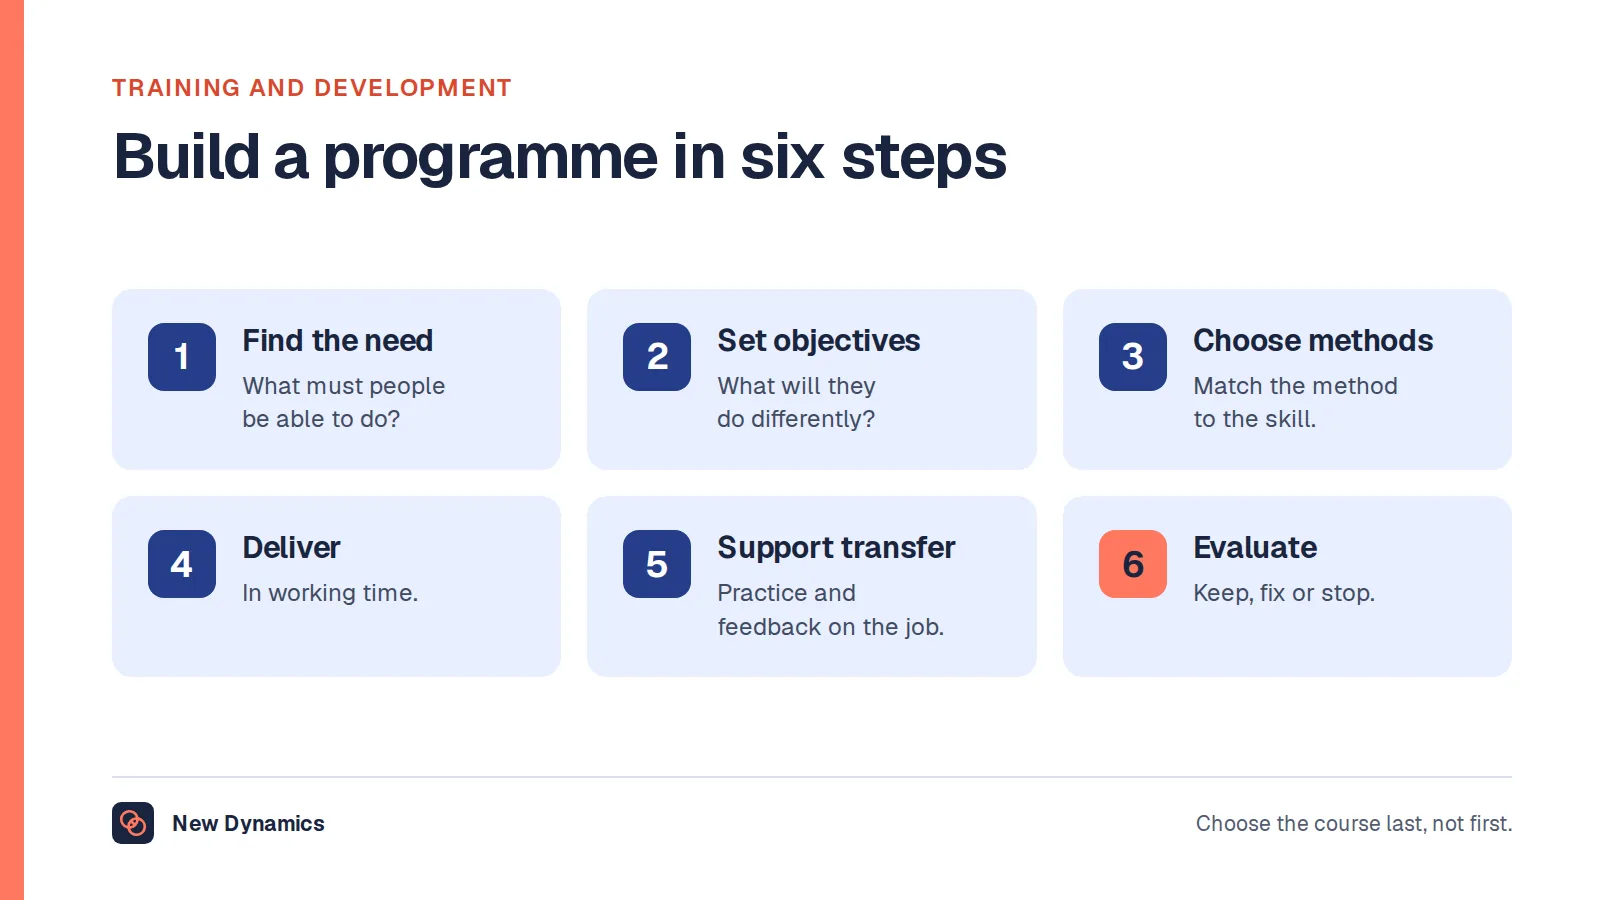
For the programmes behind the numbers, our post on employee training and development programmes covers how to structure them.
The one survey that answers most of these questions
The Employer Skills Survey is the single best source for every figure in this article. The 2024 edition was published by the Department for Education and Skills England on 24 July 2025, and it describes itself as "a large-scale telephone survey of 22,712 employers across the UK, providing labour market information on the skills challenges faced by employers". Fieldwork ran from June 2024 to January 2025, with a follow-up Investment in Training survey of 5,935 employers running from July 2024 to February 2025.
Coverage matters more here than in most series, because it changes between editions. The survey was UK-wide from 2011 to 2017, then "In 2019 ESS only covered England, with Northern Ireland, Wales, and Scotland undertaking their own national ESS in 2020". The 2022 and 2024 editions are UK-wide again. If you quote a 2019 figure as a UK number, it is wrong, and the publisher says so on the release page.
One other thing to note before quoting it. The 2024 edition used a smaller sample on purpose, because "In 2022, a pattern of alternating between large and small sample sizes was adopted", which means breakdowns are thinner in 2024 than in 2022.
Training spend per employee in the UK

The headline investment figures from the 2024 survey, covering the 12 months before interview, are these.
| Measure | 2024 | 2022 |
|---|---|---|
| Total employer training expenditure (UK) | £53.0bn | £59.0bn |
| Spend per person employed | £1,700 | £1,960 |
| Spend per person trained | £2,710 | £3,250 |
On the total, the release states that "Total employer expenditure on training and development over the previous 12 months was £53.0 billion", split almost evenly between off-the-job and on-the-job training at £26.9bn and £26.1bn.
On the per-employee figure, the one most people are looking for, it states that "Employers' total investment in training over the previous 12 months was equivalent to around £1,700 per person employed, down from around £1,960 in 2022. This represents a 29.5% decrease in real terms since 2011 and is at its lowest level since the series began".
Read that carefully, because the real-terms comparison is the finding. Training spend per employee is not drifting. On the publisher's own inflation-adjusted basis it is the lowest in a series that started in 2011.
Two splits are worth knowing. Spend per person employed was highest in Wales at £1,850, against £1,670 in Northern Ireland, £1,690 in England and £1,770 in Scotland. By sector it was highest in Construction at £2,630 per employee and lowest in Public Administration at £920 per employee.
Spend per person trained falls as employers get bigger, from £6,260 in sites with 2 to 4 employees to £1,550 in sites with 100 or more. That is the opposite of what most people assume, and it reflects fixed costs spread across a handful of people in a very small firm.
Average training hours per employee: the honest answer
No official UK series publishes training hours per employee. The Employer Skills Survey publishes days, so days are the unit to quote.
For the 12 months to the 2024 survey, employers had provided 111 million training days, "equivalent to 5.7 days per year per person trained ('per trainee'), and 3.6 days per employee". In 2022 the comparable figures were 108 million days, 6.0 days per trainee and 3.6 days per employee.
So the per-employee figure held still while the per-trainee figure fell. More people got some training, and each of them got less of it. Days per trainee were 6.4 in 2017, so the decline is sustained rather than a single year.
If somebody needs hours, convert the published days yourself and state the assumption you used for the length of a working day. Do not quote a converted figure as though the publisher produced it.
How many staff get trained
Three figures answer this, and they point in different directions.
Just under three-fifths of employers trained anybody at all: "Almost three-fifths (59%) of UK employers in 2024 had funded or arranged training over the previous 12 months for their employees". That is down from 60% in 2022 and from the 65% to 66% range seen between 2011 and 2019.
The number of people trained, though, is at a record. Employers "had trained a total of 19.6 million staff over the previous 12 months, an increase from 18.2 million in 2022 and 17.9 million in 2017, and the highest the figure has been in the ESS series". As a share of the workforce, 63% received training, up from 60% in 2022.
Size decides almost everything here. Among employers with 2 to 4 staff, 44% had trained anyone, rising to 73% at 5 to 24 employees and 96% among those with 250 or more.
Put the three together and you get the real pattern. Fewer employers are training, more individuals are being trained, each for slightly fewer days, at a lower real cost per head.
Skills gap statistics for the UK

The survey measures two different things that get confused constantly. A skills gap sits inside the existing workforce. A skill-shortage vacancy sits in the labour market outside it.
On the workforce, "In 2024, 12% of employers reported skills gaps (at least one member of staff judged to lack full proficiency), lower than in 2022 (15%)". In volume terms, 1.26 million employees in the UK were judged by employers to have a skills gap, down from 1.72 million in 2022, equivalent to 4.0% of employees against 5.7% in 2022.
On recruitment, 6% of employers had a skill-shortage vacancy, down from 10% in 2022, and there were 250,500 such vacancies. Skill-shortage vacancies were 27% of all vacancies, down from 36% in 2022 but above the 22% recorded in 2017. Construction had the highest density at 45%, and 48% of all vacancies in skilled trades roles were skill-shortage vacancies.
The release notes that "The incidence, density and volume of skills gaps in 2024 was lower than at any other time in the ESS series". Be careful with that. Employers reported far fewer vacancies of any kind in 2024, with total vacancies down from 1,495,000 to 938,800, and a judgement about proficiency is a judgement rather than a test. Fewer reported gaps in a slacker labour market is not the same as a better trained workforce.
Apprenticeships, where the data arrives quarterly
Apprenticeship statistics are the one part of this picture updated through the year, and they cover England only. The release published on 16 July 2026 gives provisional figures for August 2025 to April 2026: "Apprenticeship starts increased by 8.7% to 308,770 compared to 284,190 reported for the previous year", with participation up 4.6% to 735,500 and achievements up 14.0% to 146,210.
Higher apprenticeship starts rose 13.6% to 126,660. If your workforce plan assumes apprenticeships are mostly an entry route for school leavers, that is worth checking, because under 19s accounted for 20.6% of starts.
Where learning and development is going backwards
One large employer group publishes how its own people rate development, which is the measure no spending figure captures.
The Civil Service People Survey 2025, updated on 28 May 2026 and answered by 343,961 civil servants from 102 organisations at a 59% response rate, reports nine theme scores. Compared with 2024, "All other theme scores went down with 'Learning and development' having the largest decrease (down 2pp)".
Of nine themes in one of the largest employers in the country, development fell furthest. Set that next to a real-terms low in spend per employee and the two sources agree, from opposite ends: one counts the money, the other asks the people.
For the wider set of published UK figures on work, pay and the workforce, our HR statistics hub collects them with the publisher and the period attached.
What usually goes wrong with these figures
- Quoting a 2019 Employer Skills Survey figure as a UK number, when that edition covered England only.
- Mixing spend per employee with spend per person trained. In 2024 those were £1,700 and £2,710, and they answer different questions.
- Quoting a cash total across years without the publisher's real-terms adjustment, which turns an 18.5% fall since 2011 into an apparent rise.
- Treating a lower skills gap density as proof of better skills, when vacancies fell by more than a third in the same period.
- Reporting apprenticeship figures for England as UK figures.
- Quoting training hours when no official UK source publishes hours.
The training statistics worth producing yourself

Every measure below is available inside your own organisation, and each has a published national counterpart you can sit beside it.
- Spend per employee, as your total training cost divided by average headcount. Compare it with £1,700, and include internal time if you can.
- Days per employee and days per person trained, kept as two separate numbers. The national pair is 3.6 and 5.7.
- The proportion of staff who received any training in the last 12 months. The UK figure is 63%.
- The proportion of roles where a manager says someone is not yet fully proficient, which is your own version of the 4.0% skills gap density.
- Time from an agreed development action to the first session booked. Nobody publishes this, and it is usually where a development plan dies.
Our post on the skills matrix sets out how to record the fourth of those without turning it into a ratings exercise.
Frequently asked questions
What is the average training spend per employee in the UK?
The Employer Skills Survey 2024, covering the whole UK, reports total employer investment in training equivalent to around £1,700 per person employed over the previous 12 months, down from around £1,960 in 2022. The publisher describes this as a 29.5% decrease in real terms since 2011 and the lowest level since the series began in 2011.
What is the average number of training hours per employee?
No official UK statistic publishes training hours per employee. The Employer Skills Survey publishes days instead: 111 million training days over the 12 months to the 2024 survey, equivalent to 3.6 days per employee and 5.7 days per person trained. Any hours figure in circulation is a conversion, so state the working day you assumed.
How many UK employers provide training?
Almost three-fifths, at 59% of UK employers in the 12 months before the 2024 survey. That is down from 60% in 2022 and from the 65% to 66% range recorded between 2011 and 2019. Likelihood rises steeply with size, from 44% of employers with 2 to 4 staff to 96% of those with 250 or more.
What are the UK skills gap statistics?
In the 2024 survey, 12% of UK employers reported at least one member of staff judged to lack full proficiency, down from 15% in 2022. That covered 1.26 million employees, or 4.0% of the workforce, against 5.7% in 2022. Separately, 6% of employers had a skill-shortage vacancy, and 27% of all vacancies were skill-shortage vacancies.
Is the Employer Skills Survey UK wide or England only?
It depends on the edition, which is why the reference period matters. The survey was UK-wide from 2011 to 2017, covered England only in 2019 while the other three nations ran their own surveys in 2020, and was UK-wide again in 2022 and 2024. Apprenticeship statistics, by contrast, cover England.
Are UK skills gaps getting better?
The reported figures are the lowest in the series, but read them in context. Employers reported 938,800 vacancies in 2024 against 1,495,000 in 2022, so there were far fewer roles of any kind to struggle with, and a skills gap is an employer's judgement about proficiency rather than a test of it. Falling reported shortfalls are not the same as rising skills.
Your next step: produce your own four numbers
- Work out your training spend per employee for the last 12 months, and write down whether internal time is included.
- Split your training days into days per employee and days per person trained. The gap between them tells you whether training is concentrated in a few people.
- Count the proportion of staff who received any training, and compare it with 63%.
- Ask managers which roles are not yet fully proficient, and record it once rather than in four spreadsheets.
For the method behind the fourth step, read and download our skills gap analysis guide. The guide is free to read, and the PDF uses our short download form.
Want development objectives that are visible all year rather than recalled in one meeting? Book a New Dynamics demo and bring last year's training spend. You can also email contact@new-dynamics.com.