TL;DR
- The phrase was built on one American number. The US quits rate stood at 2.3% in almost every month of 2019, peaked at 3.0% in November 2021, and was 2.1% in September 2026, below where it started.
- The UK record was for job-to-job moves, not resignations. The ONS reported a record high of 988,000 moves in October to December 2021, in a series that only begins in October to December 2001, and resignations were about a third of those moves.
- No official UK source publishes a general breakdown of why people of all ages resign. The one official reasons study covers adults aged 50 to 65 who left work during the pandemic, and retirement was the largest reason.
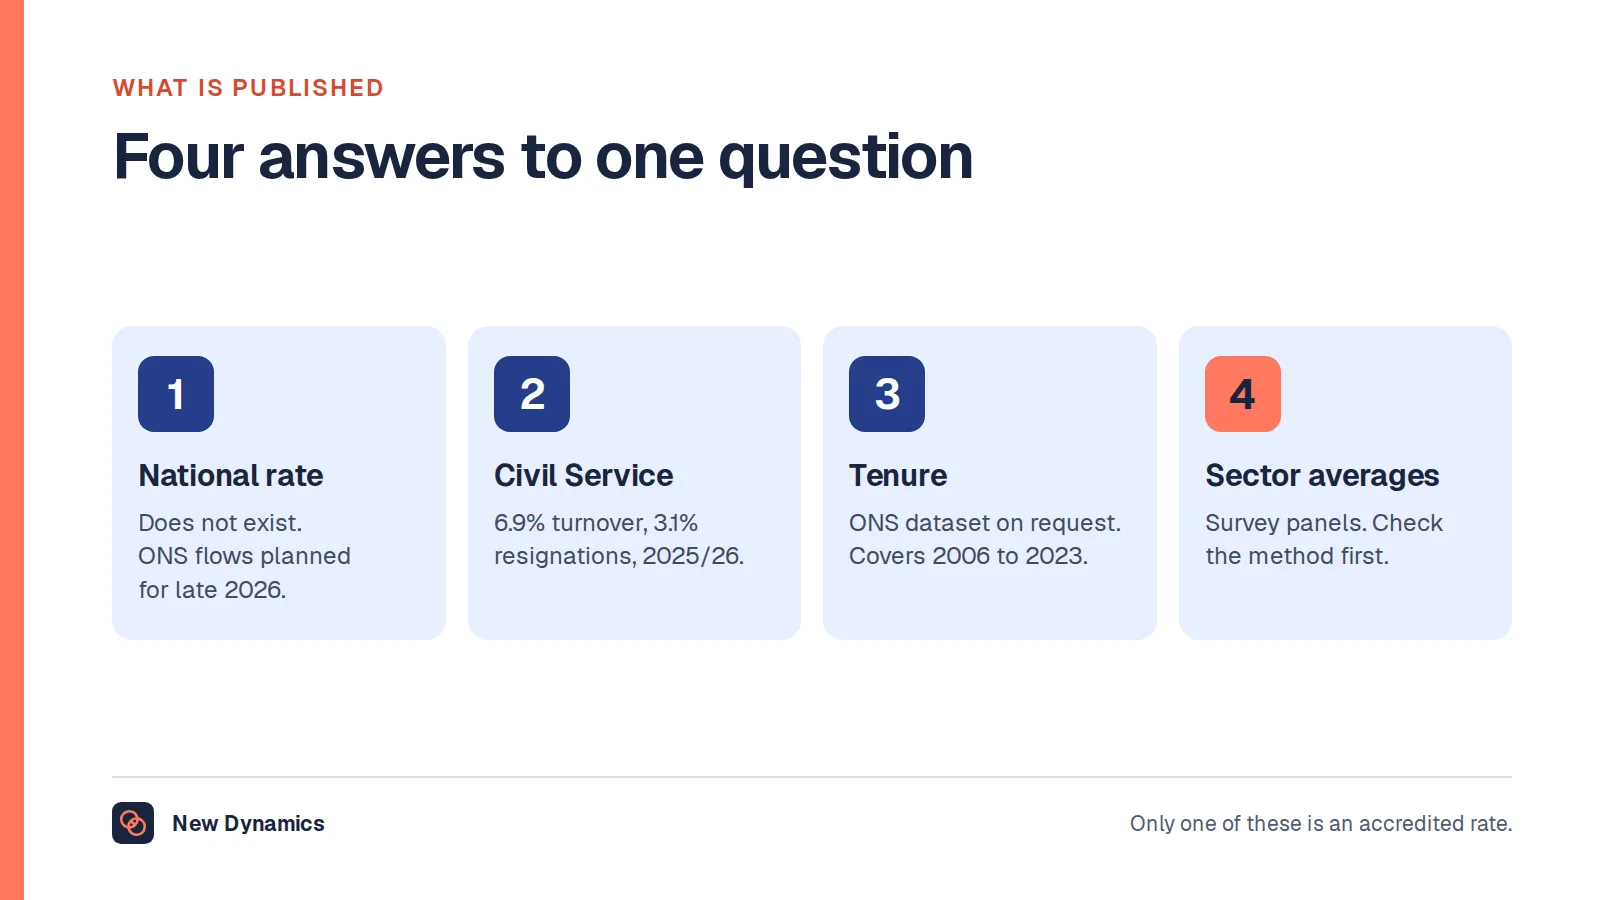
The great resignation is a phrase, not a statistic. No statistical agency publishes a series by that name, in either country. Two official series come closest, one American and one British, and they do not tell the same story.
This article tests the claim against those series: the Bureau of Labor Statistics in the United States, which publishes the quits rate the phrase was built on, and the Office for National Statistics in the United Kingdom, which publishes job-to-job moves. Every figure below comes from a dated release with its reference period named, and no consultancy or vendor survey appears anywhere in it, including for the question of why people left.
Whether any of this is happening to you is a separate question, and the evidence has to come from your own people. See how New Dynamics feedback keeps the reasons on record while the people are still in post.
Where the phrase came from
The phrase was coined in May 2021 by Anthony Klotz, then an associate professor of management at Texas A&M University, in an interview with Bloomberg. He said the great resignation was coming. It was a forecast about the United States, made before the data that would test it existed.
What followed was a very large volume of survey material from consultancies, job boards and software vendors, much of it with panels that were never published. None of it is quoted here. The BLS counts quits inside the Job Openings and Labor Turnover Survey. The ONS counts job-to-job moves inside its Labour Force Survey flows dataset. Those are the measures. Everything else is interpretation of them.

The United States: the quits rate is the real series
The BLS defines the measure in the technical note to every Job Openings and Labor Turnover Survey release. In the release published on 3 November 2026 it reads: "Quits are generally voluntary separations initiated by the employee. Therefore, the quits rate can serve as a measure of workers' willingness or ability to leave jobs." The same note is narrower than most people assume: "Quits include employees who left voluntarily, with the exception of retirements or transfers to other locations."
The peak is easy to date. The release published on 4 January 2022, covering November 2021, states: "The number of quits increased in November to a series high 4.5 million (+370,000). The quits rate increased to 3.0 percent, matching the series high in September."
Now put that against the baseline. The BLS series for the total nonfarm quits rate, seasonally adjusted, records 2.3 percent in every month of 2019 except July 2019, which was 2.4 percent. The peak therefore sat about 0.7 percentage points above a very stable pre-pandemic level, roughly three quitters for every two before. That is a genuine shift, and it is not an exodus.
It also did not last. The release published on 3 November 2026, covering September 2026, states: "The number of quits increased to 3.4 million, while the rate was little changed at 2.1 percent in September." That is below the 2019 level. On the measure the phrase was built on, in the country it was coined about, the episode ran for roughly eighteen months and then reversed past its starting point.
The United Kingdom: a record, but for a different thing
The British version of the story rests on one ONS sentence. In Employment in the UK: February 2022, released on 15 February 2022, the ONS wrote: "Total job-to-job moves also increased to a record high of 988,000, driven by resignations rather than dismissals, during the October to December 2021 period."
Three things in that sentence get lost when it is repeated.
A job-to-job move is not leaving work. The ONS defines the flow in its flows dataset as "those who were employed in both quarters, but who in the latter quarter reported being with their current employer for less than three months, indicating a change of job between the quarters". These are people who were in work before and in work after. They changed employer.
The record is a record in a short series. The reason table in the ONS X02: Labour Force Survey flows estimates dataset runs from October to December 2001. In the edition published on 18 August 2026, the seasonally adjusted job-to-job move rate reads 3.28% for October to December 2021 against 3.08% for October to December 2001. A record, by about a fifth of a percentage point, over a period of twenty years.
It is over. The same edition puts the rate at 2.31% in April to June 2026, below the 2.51% recorded in October to December 2019. As in the United States, the series has returned below its pre-pandemic reading.
"Driven by resignations" is narrower than it sounds
The ONS flows dataset splits job-to-job moves by reason, which makes the phrase checkable. In the edition published on 18 August 2026, the not seasonally adjusted figures for October to December 2021 are a total of 1,139,778 moves, of which 378,841 were resignations, 28,157 were dismissals and redundancies, 52,269 chose to leave their previous job, and 680,511 fell under other reasons.
So resignations were about a third of the moves at the peak. The ONS phrase is a comparison with dismissals, and on that comparison it holds easily, because dismissals and redundancies were unusually low. It is not a statement that most movers resigned. The largest category is the residual one, and the ONS says what is inside it: "Includes those whose temporary job came to an end or who left their previous job for health reasons, education or training purposes or some other reason. It also includes those who did not provide a reason."

Resignations within job-to-job moves did not peak in that quarter either. On the same table the highest quarter is April to June 2022, at 446,440. The ONS advises comparing like quarters, and on that basis resignations are now close to their pre-pandemic level: 243,109 in April to June 2026 against 223,996 in April to June 2019.
Did people leave work altogether?
This is the part of the story with more in it. The ONS flows dataset also counts movements from employment into economic inactivity, meaning people who stopped being in work and stopped looking. Seasonally adjusted, that flow reads 663,056 for October to December 2021 against 523,847 for October to December 2019. The highest quarter in the series is April to June 2020, at 714,943, in the first months of the pandemic rather than at the height of the great resignation talk.
For why those people left, there is exactly one official UK study, and it is narrow. In Reasons for workers aged over 50 years leaving employment since the start of the coronavirus pandemic: wave 2, released on 27 September 2022, the ONS reports: "Among those who left work since the start of the coronavirus (COVID-19) pandemic and had not returned when surveyed in August 2022 over 3 in 10 (36%) adults left to retire." The same release reports that adults aged 50 to 54 years "were more likely to leave work due to stress (19%) or not feeling supported in their job (17%), compared with those aged 60 to 65 years (10% and 8%, respectively)".
That study covers Great Britain, adults aged 50 to 65, surveyed between 10 and 29 August 2022. It is not a reading of the whole workforce. No official UK source publishes a general breakdown of why people of all ages resign, which is why the "reasons people left" tables in circulation almost all come from private surveys with panels you cannot inspect.
The caveats the statisticians state themselves
Both agencies are explicit about the limits of these numbers, and the warnings are worth more than most of the commentary built on them.
The note at the front of the ONS flows dataset published on 18 August 2026 says: "Caution should be taken when drawing conclusions from short-term changes; we advise users to focus on long term movements in the data." It adds: "Due to resource issues the flows estimates this period are based on a smaller dataset and so they will be subject to lower accuracy and greater volatility." The ONS makes the same point about the survey behind them in its Labour market overview, UK: October 2026, released on 20 October 2026: "Despite the improvement in LFS responses, some volatility remains, particularly for estimates for mid-2023 and throughout 2024, and for granular breakdowns, where sample sizes are smaller."
There are breaks in the series too. A footnote to the flows table states that "Data from Jan-Mar 2019 are weighted to the same population totals as the quarterly Labour Force Survey estimates, resulting in a discontinuity in these series", and one cell in the resignations column, April to June 2024, carries the note "Estimate has been suppressed on disclosure grounds".
The BLS states its own position in the technical note to the 3 November 2026 release: "JOLTS estimates are subject to two types of error: sampling error and nonsampling error." These are sample estimates with error bars, not a census of every leaver.
So was there a great resignation?
In the United States, something real and measurable happened, and it is smaller than the name suggests. The quits rate rose about 0.7 percentage points above a flat pre-pandemic level, peaked at 3.0 percent in November 2021, and had fallen to 2.1 percent by September 2026, below where it started. A rise of that size sustained for about eighteen months is a meaningful change. It is not a mass departure from work.
In the United Kingdom, the data does not support a great resignation in the usual sense. What the ONS recorded was a record quarter for people moving between employers, narrowly ahead of a level last seen in 2001, in which resignations were about a third of the moves, and the rate is now below its pre-pandemic reading. The better description of the UK episode is a reshuffle in a market with record vacancies. The one group where people genuinely did leave work in larger numbers was older workers, and the leading official reason given was retirement.
What an employer should actually do with this
Nothing in either series tells you anything about your own organisation. A national rate is an average of millions of employment relationships, none of them yours.

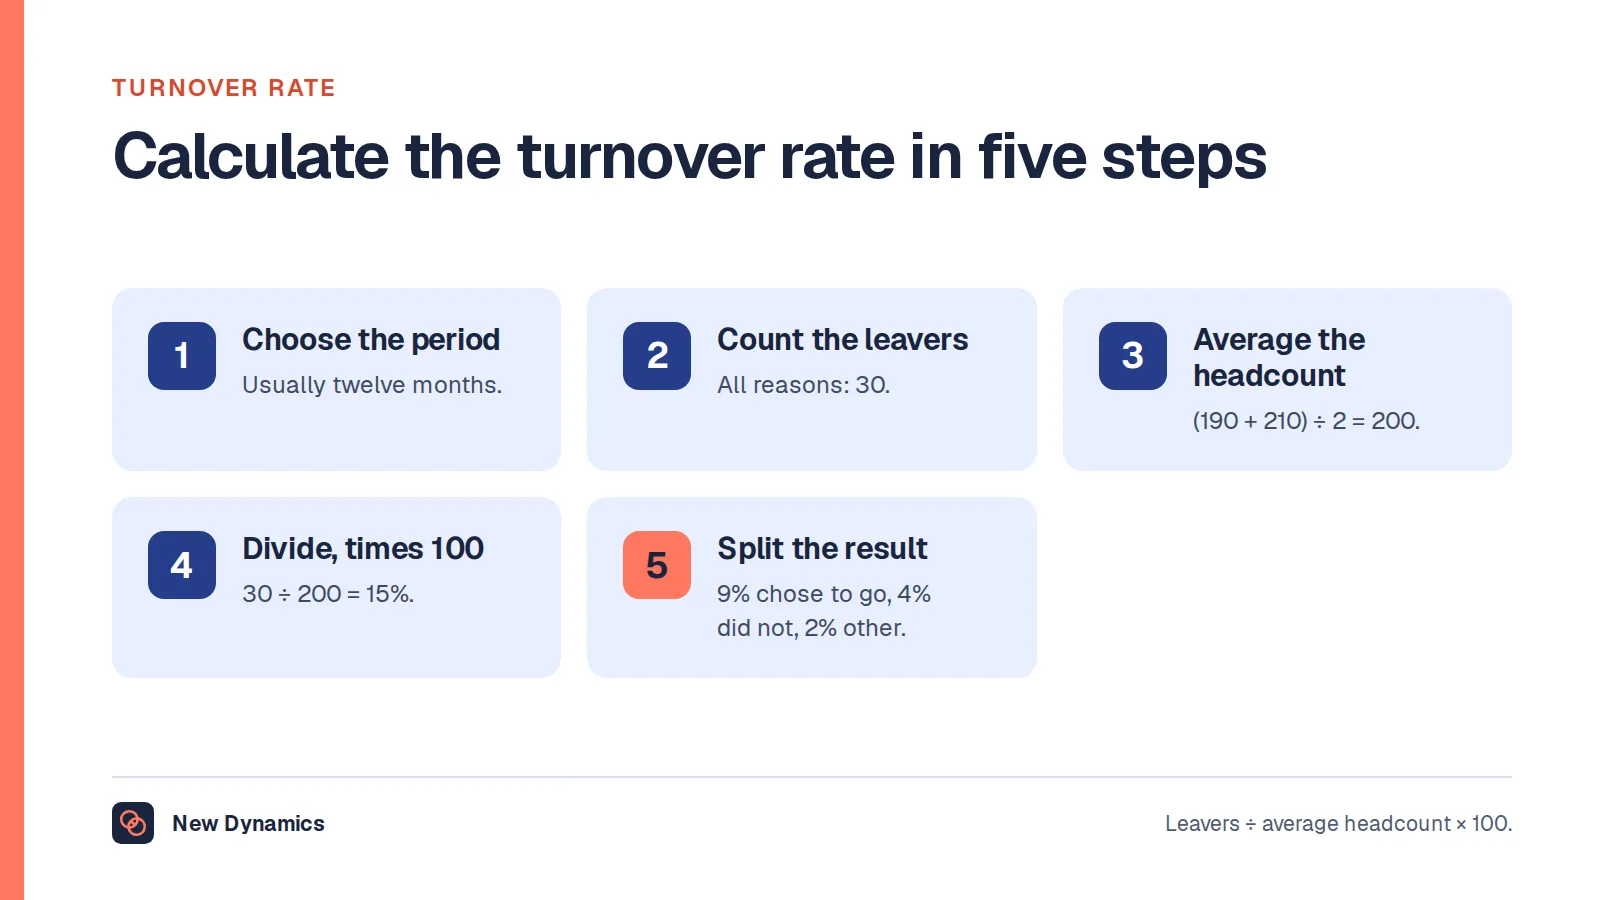
- Write down your own definition of a leaver first, including how you treat redundancies, fixed-term endings, retirements and internal transfers. Our post on the turnover rate sets out the formula and the choices inside it.
- Recalculate three years on that one definition. Your own trend is the only comparison that holds, as our post on the UK employee turnover rate explains, because no official national rate exists to compare against.
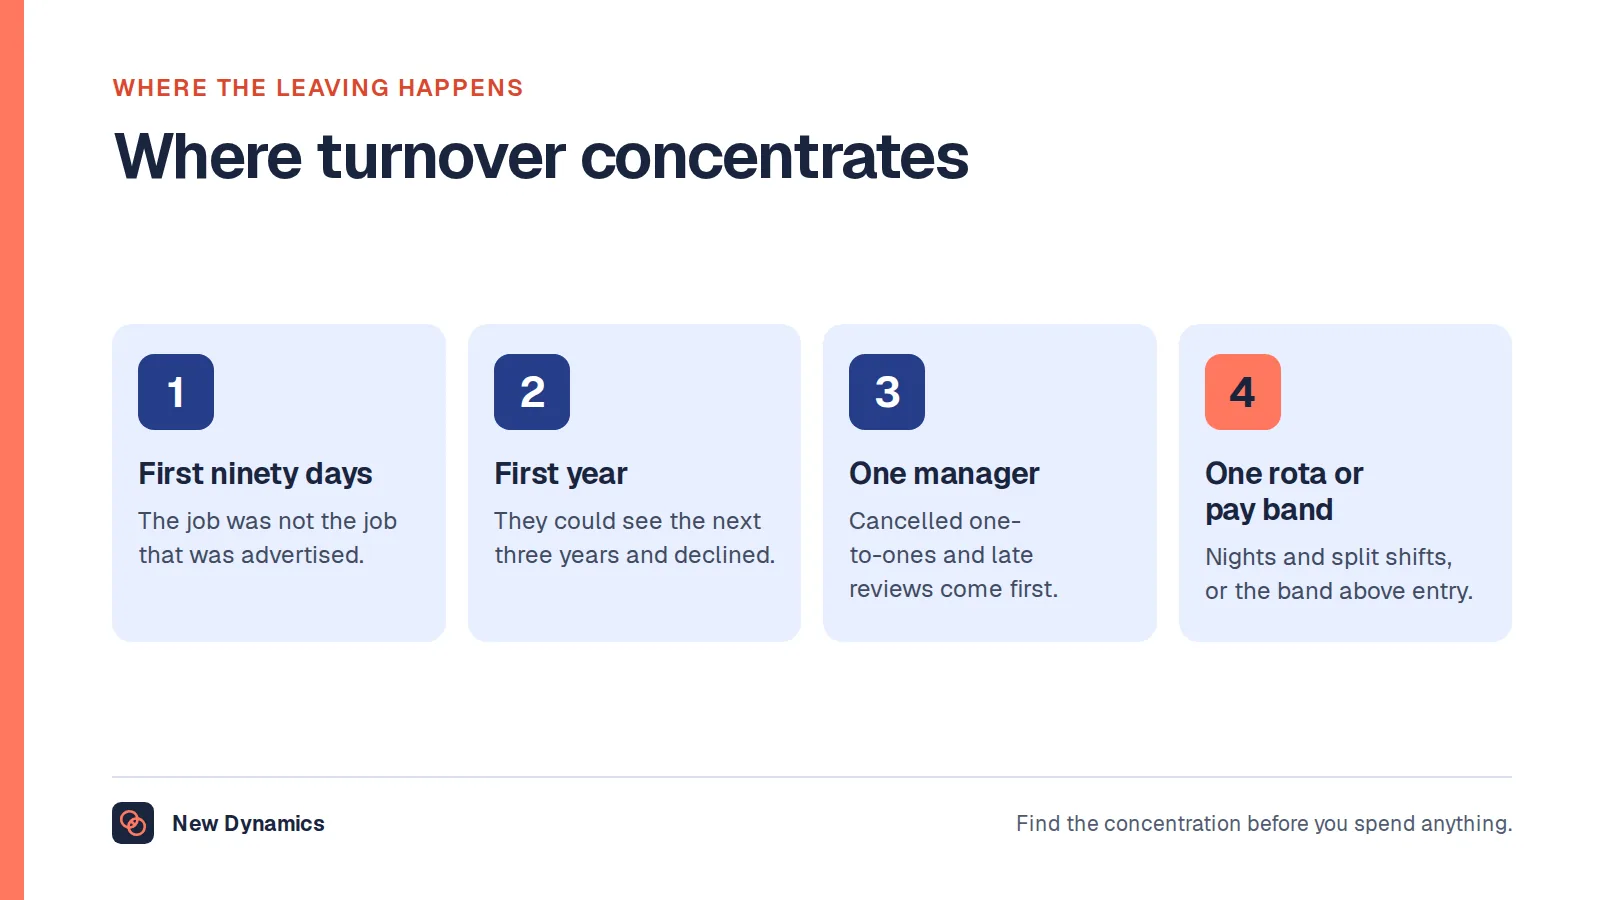
- Split voluntary from involuntary, and first year from the rest. That is where cause lives, and it is what most internal reports leave out. Our post on high employee turnover covers where leaving concentrates.
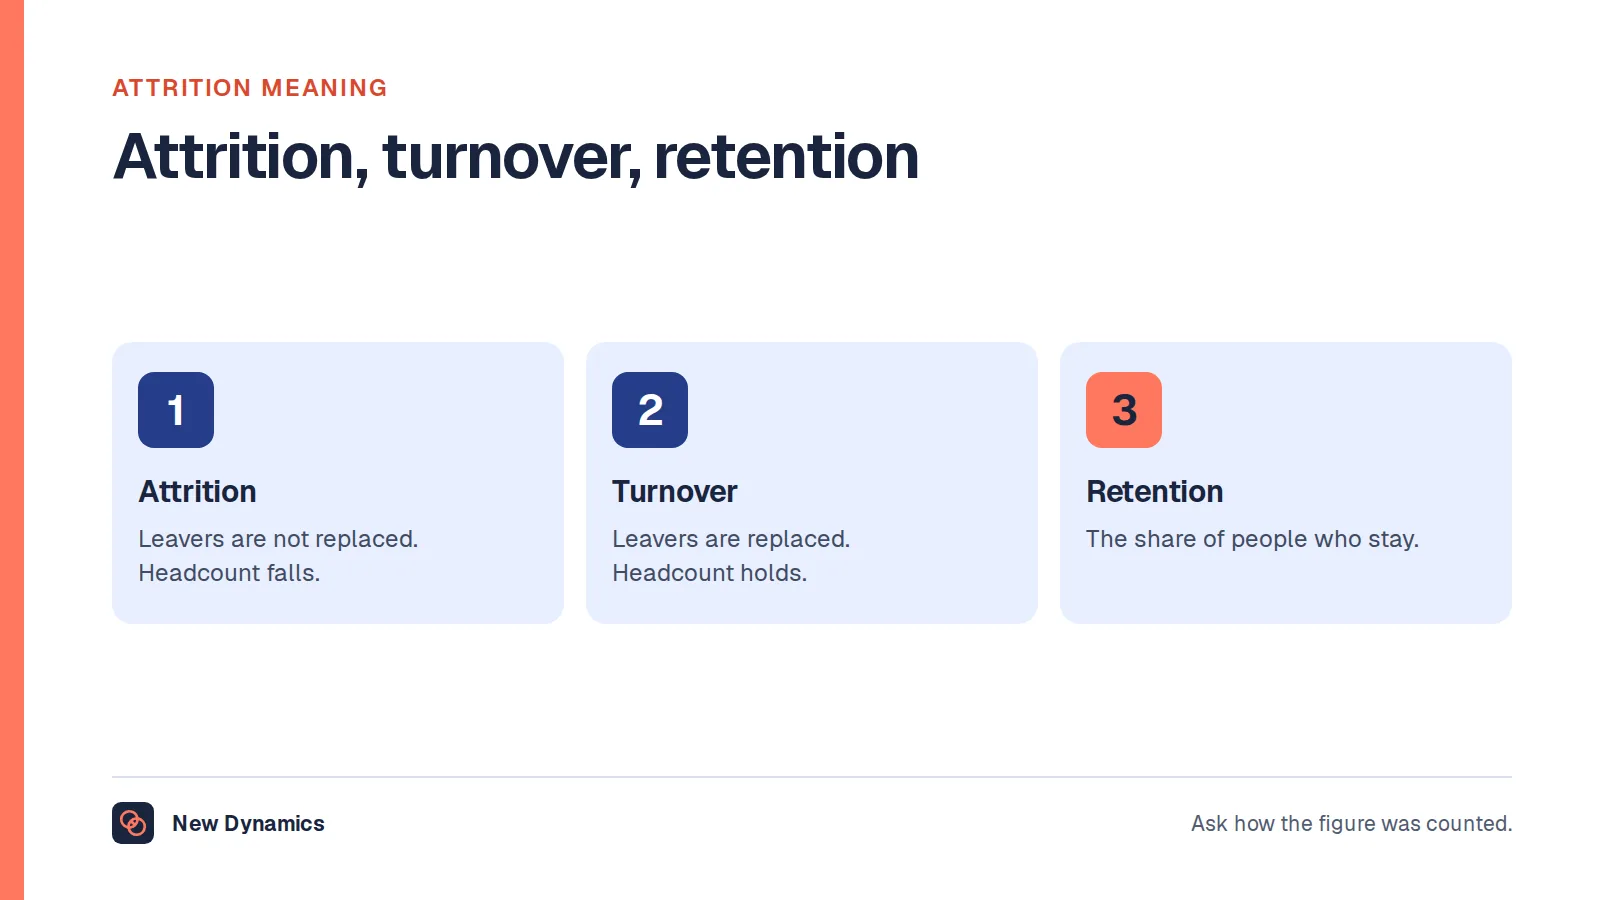
- Ask the people who are still here. Exit evidence arrives after the decision. For the vocabulary, see attrition meaning and employee retention meaning.
For the wider picture of what is and is not published, our HR statistics hub collects the figures with their reference periods attached.
Frequently asked questions
Was the great resignation real?
In the United States it was real and measurable. The BLS quits rate rose from 2.3 percent in almost every month of 2019 to a peak of 3.0 percent in November 2021, then fell to 2.1 percent by September 2026. That is a clear rise and a clear reversal, and it is smaller than the name implies.
Was there a great resignation in the UK?
Not in the sense of people leaving work in unprecedented numbers. The ONS recorded a record high of 988,000 job-to-job moves in October to December 2021, which counts people who changed employer while staying in work. The series only begins in October to December 2001, and the record was narrow.
Is the great resignation over?
Both series say yes. The US quits rate was 2.1 percent in September 2026, below its 2019 level. The ONS job-to-job move rate was 2.31% in April to June 2026, below the 2.51% recorded in October to December 2019.
What is the quits rate?
It is the BLS measure of voluntary separations. The Job Openings and Labor Turnover Survey release of 3 November 2026 defines it as follows: quits are generally voluntary separations initiated by the employee, so the quits rate can serve as a measure of workers' willingness or ability to leave jobs. Retirements and transfers are excluded.
Why did people leave their jobs during the great resignation?
No official UK source publishes a general breakdown by reason. The one official study, released by the ONS on 27 September 2022, covers adults aged 50 to 65 in Great Britain who left work during the pandemic, and found that 36% of those who had not returned left to retire. Anything broader than that is private survey material.
Does the UK have an official resignation rate?
No. The ONS publishes resignations only as a reason category within job-to-job moves in its flows dataset, which counts people who changed employer. There is no national resignation rate covering everyone who leaves an employer.
Your next step
- Open your last three years of leaver data and write one definition that applies to all three.
- Calculate the voluntary rate and the first-year rate separately from the overall rate.
- Compare the three years with each other, and with nothing else.
- Pick the one group whose rate you cannot explain, and talk to the people still in it.
For the practices behind the number, read and download our employee retention guide. The guide is free to read, and the PDF uses our short download form.
Want your own leaver reasons on record before the resignation letter arrives? Book a New Dynamics demo and bring last year's leaver list. You can also email contact@new-dynamics.com.