TL;DR
- No official United Kingdom source publishes a target or acceptable turnover rate, and rates differ so much by sector that one number could not serve both a warehouse and a research team. Judge your figure against your own history, your own definition and published data for work like yours.
- A rate is an average of several different problems. Almost every high turnover figure resolves into a few concentrations: the first ninety days, the first year, one manager, one shift pattern or one pay band. Find the concentration before you spend anything.
- The common causes are the job being different from the advertised job, a manager nobody supervises, pay that is unexplained rather than low, no visible next step, and a rota or workload the person cannot plan around. The usual responses, a retention bonus and an exit survey, treat none of them.
Somebody says the turnover is too high. Usually they are right, and usually nobody can say what "too high" would have been, or which part of the organisation is producing it. So the conversation goes to a number, the number goes to a benchmark somebody half remembers, and three months later a retention bonus has been paid to people who were never going to leave.
High employee turnover is a diagnosis, and the diagnosis is almost never "the rate is 19%". It is "we lose a third of new starters before month four", or "two of our eleven managers produce half our resignations", or "everybody on the night rota goes within a year". This article is about getting from the first sentence to the second: what high turnover means, why the benchmark question has no honest general answer, how to judge your own figure, where the leaving actually happens, which causes the evidence supports, and what to do and not do about each.
Early leaving is the largest single piece of most high turnover figures. See how New Dynamics onboarding brings a new starter's tasks, early goals and manager check-ins into one visible path.
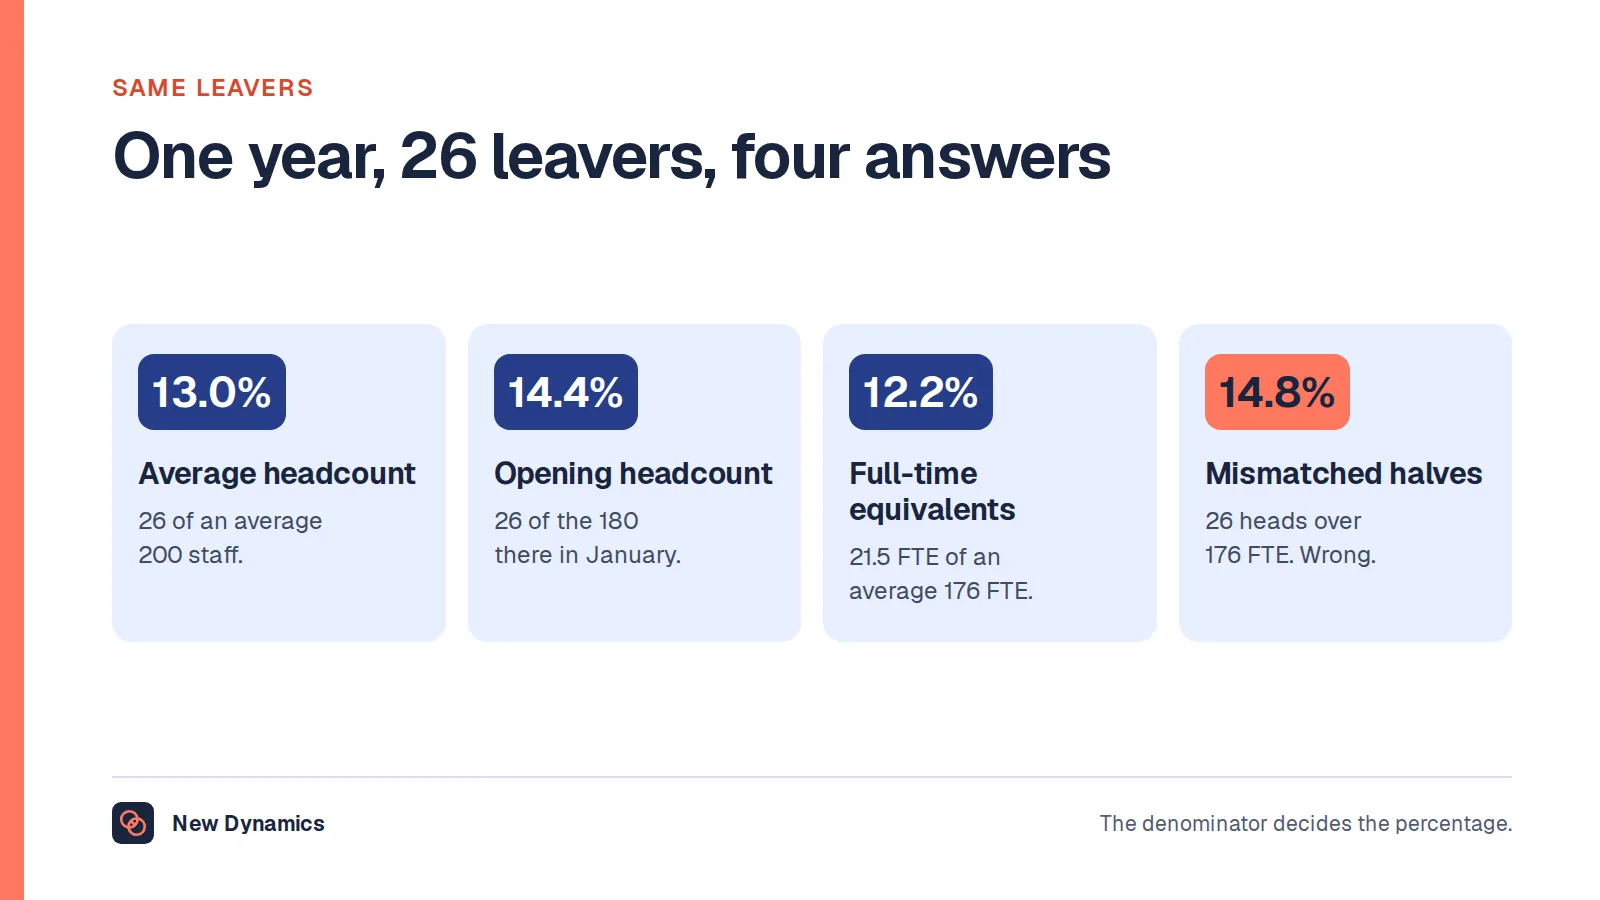
Two neighbouring questions are answered elsewhere. For the arithmetic, the three denominators and what counts as a leaver, see employee turnover calculation. For the vocabulary, including how attrition differs from turnover and what natural wastage means, see the meaning of attrition. This article assumes you already have a number and now have to decide what it tells you.
High turnover meaning: what the phrase actually claims
Start with the plain definition, because the phrase is used for three different claims and the three have different answers.
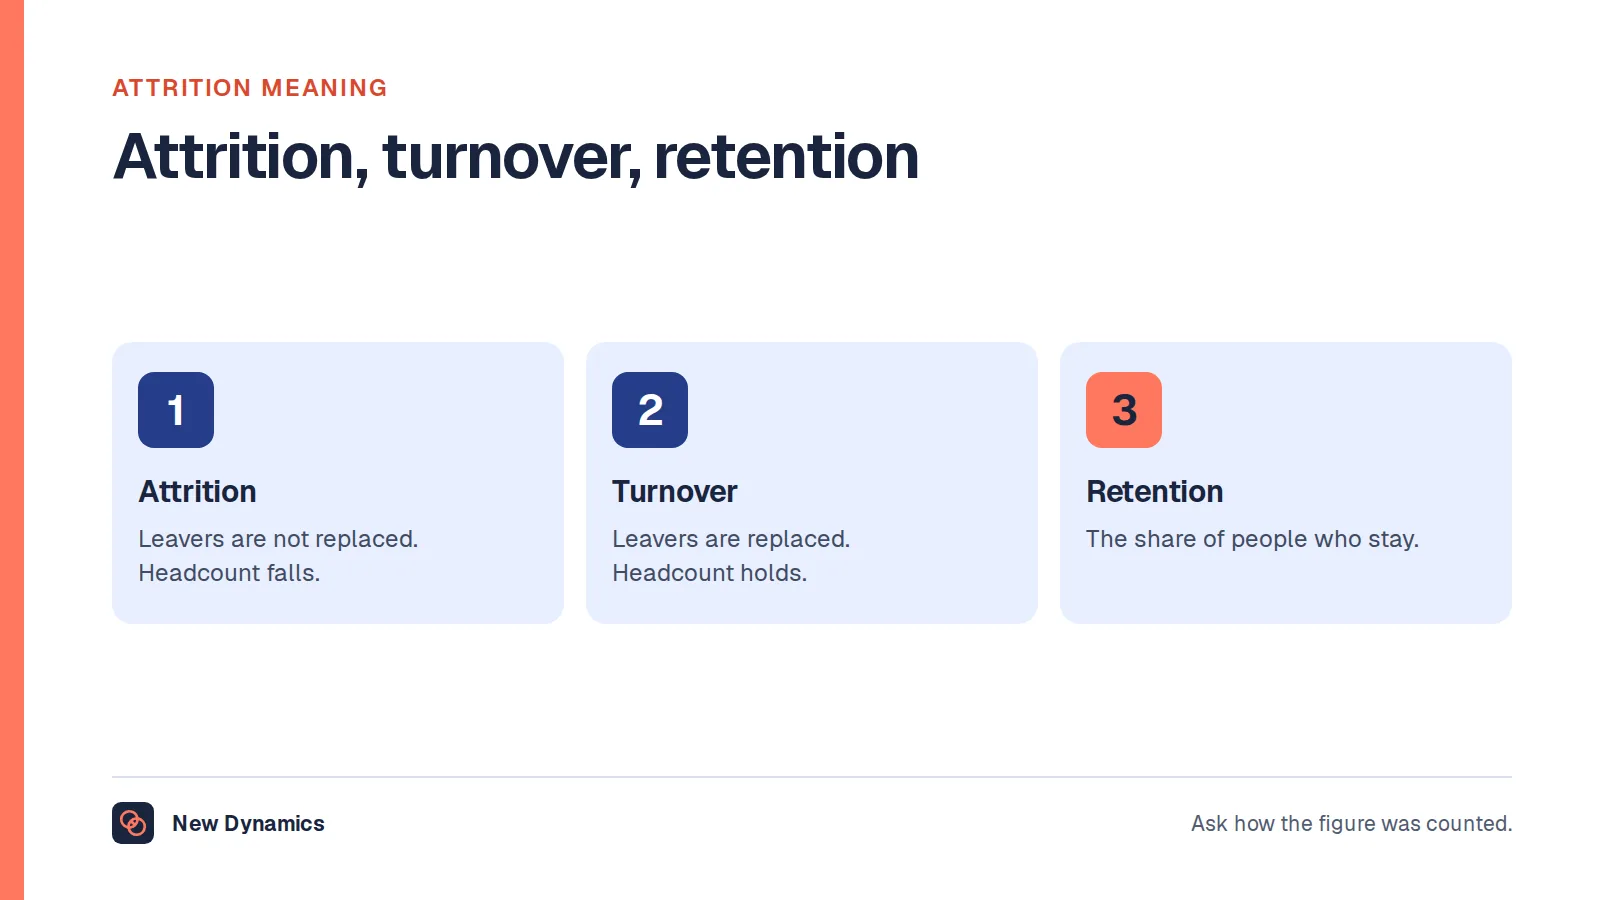
Turnover of employees means people leaving an organisation and being replaced. The rate is leavers in a period divided by employees in the period, times 100. High turnover means that rate is high enough to cost the organisation something it notices. High attrition usually means the same thing, with attrition used loosely as another word for turnover, although in its strict sense attrition means leavers who are not replaced.
The three claims hidden inside "our turnover is high" are these.
- High against our own history. The rate has risen, or one part of it has. This is the only version you can settle from your own data, and the most useful.
- High against work like ours. Similar employers in similar labour markets lose fewer people. Answerable with care, and mostly not answerable from the data published in the United Kingdom.
- High against what it costs us. The leaving is expensive or disruptive enough to be worth money and management attention. This is the version that decides whether anybody acts, and it has nothing to do with percentages.
A seasonal attraction with 60% turnover and no recruitment difficulty is not in trouble. A specialist engineering team with 9% turnover, where the 9% is the two people who understood the legacy system, is in serious trouble. The percentage ranked those two the wrong way round.
So when somebody reports high turnover, ask which of the three claims they are making. Often that ends the argument, because the answer is the first claim and the data to settle it is already in the system.
What is a high turnover rate? Nobody official publishes a number
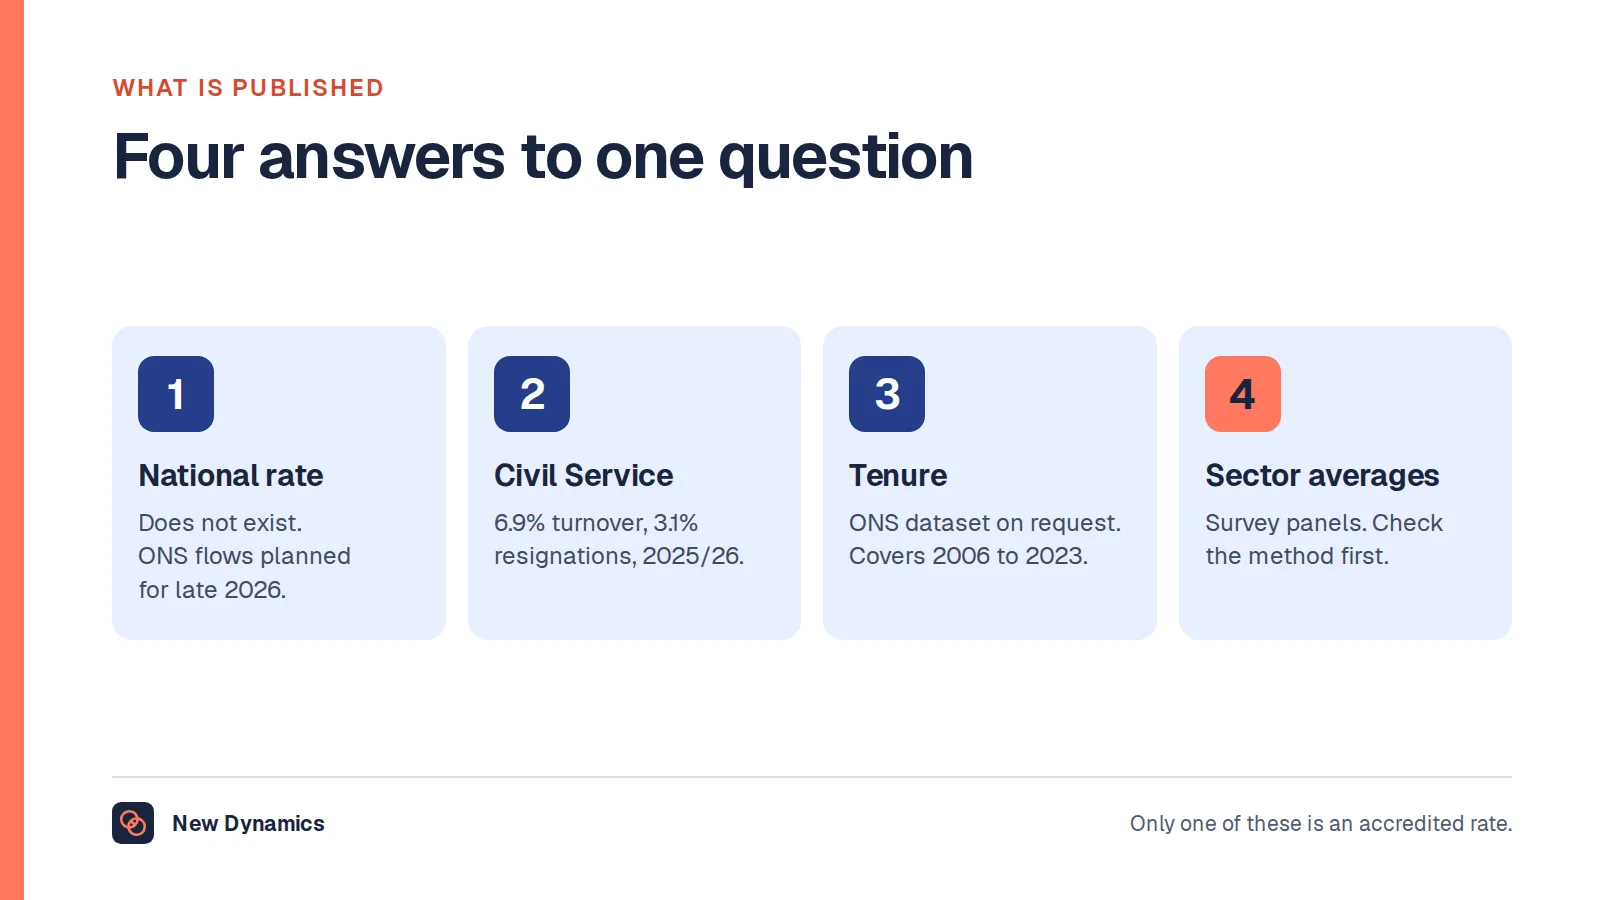
Readers arrive at this question wanting a threshold: 10%, 15%, 20%, above which turnover is officially a problem. It is worth being direct. No official United Kingdom source publishes a target, an acceptable level or a threshold for employee turnover. Not the Office for National Statistics, not GOV.UK, not ACAS. Any figure presented as the standard comes from a private survey panel whose method and membership you cannot inspect, and those numbers are usually averages of whoever answered rather than standards of any kind.
There is a structural reason as well as an evidentiary one. The ONS does not yet publish national turnover at all. In its labour market transformation update of 11 August 2026 it states: "We plan to publish the first set of experimental labour market flows statistics in late 2026, which would capture movements in and out of payrolled employment, including job-to-job flows between and within industries." A statistic that is planned is a statistic that does not exist yet. Our post on the UK employee turnover rate sets out what that leaves.
What does exist is turnover published by individual large employers and sectors, with their method stated. Two are worth knowing, because they show what a real published rate looks like.
The Civil Service. Civil Service Statistics 2026, published on 28 October 2026 and measured as at 31 March 2026, reports: "The turnover rate in the Civil Service fell to 6.9% from 7.1% in 2024/25. The resignation rate fell to 3.1% from 3.6% in 2024/25." The same bulletin records that "Over the year, 37,945 people left the Civil Service, down from 38,610 in 2024/25" and that "The most common reason for leaving the Civil Service is resignation, accounting for 17,085 leavers. The next most common reason is retirement (10,895)."
State-funded schools in England. The Department for Education's School workforce in England release, published on 4 June 2026, reports that "38,600 FTE teachers left the state-funded sector in 2024/25, a decrease compared to 40,700 in 2023/24", which it describes as "1 in 12 (8.5%) of all qualified teachers".
Notice two things. Both publishers state the population, the period and the counting rule, which is what makes the figure usable. And neither calls its rate high or low. A statistical bulletin reports; it does not grade.
Those are figures for two parts of the public sector. They are not thresholds for a software company or a care home, and using 6.9% as a target for a seasonal retailer would be absurd. The published landscape gives you comparable data for a few named employer groups and nothing for most of the economy. The wider set of figures we can source sits on our HR statistics hub.
How to judge whether your own figure is high
If there is no external threshold, you need an internal test. Four questions settle it, and all four can be answered from data you already hold.
One: is it moving, on a definition that has not moved? Recalculate the last three years on today's leaver rule and today's denominator, not on whatever each year used at the time. Most organisations find at that point that part of their trend was a change of method. A rate that fell two points because somebody stopped counting fixed-term endings is not an improvement.
Two: is it concentrated? Split the rate by tenure band, team, manager, site, shift and pay band. If the organisation sits at 18% and one department sits at 41%, you do not have a turnover problem of 18%. You have a specific problem of 41% and a tolerable background rate. The next section is about where that concentration usually is.
Three: is it expensive? Cost one role properly: recruitment, cover, training, the reduced output while the new person learns, and the knock-on effect on whoever absorbed the work. Then multiply by the leavers in that role. A rate becomes a case for action when it has a cash figure beside it, and not before.
Four: is it the people you wanted to keep? Mark each leaver regretted or not, and voluntary or involuntary. Four points of turnover made up of people you had already decided to manage out is a different event from four points of your most capable staff resigning.
To compare outwards as well, do it as a method rather than a number hunt. Our post on benchmarking sets out how to check a comparison is actually comparable: the same definition, the same population, the same period, a visible collection method. Applied to turnover, that test rules out almost every circulating industry average, which is the point.

One practical note on small teams. In a team of eight, one leaver is 12.5%. Report counts alongside percentages wherever the denominator is under about thirty, or you will spend the year explaining swings of one person.
Where the leaving actually happens
A high turnover figure is an average of several unrelated problems, and the average is almost always produced by a few concentrations. Five places account for most of them.
The first ninety days
New starters who leave inside three months are the largest single component of high turnover in most organisations, and the most fixable. They also fail silently, because somebody who leaves in week six often never appears in the leaver analysis as anything other than a line.
Early leaving usually points backwards at recruitment rather than forwards at retention. The job was described differently from the job. The rota was not mentioned. The equipment did not arrive. Nobody was expecting them. ACAS guidance for employers on probation reviews is useful here precisely because it treats the early period as something to be managed rather than waited out: it says that "Employers should decide how many reviews to have and when to have them", that employees "should also have regular informal check-ins throughout their probation period", and that regular reviews help "make sure the probation outcome is not a surprise to the employee".
Measure this directly. The share of starters still employed at ninety days, by month of joining and by recruiting manager, tells you more than the annual rate will. Our onboarding check-ins post covers the conversations, and the employee onboarding checklist covers the mechanics that stop week one going wrong.
The first year, and the shape of the curve
After the first ninety days comes the first anniversary, and the two are different problems. Ninety-day leavers usually left because the job was not what they were told. One-year leavers more often left because they could see the next three years and did not want them.
Published cohort data shows what the shape looks like when it is measured properly. The same Department for Education release reports that "Almost 9 in 10 (89.7%) teachers who qualified in 2024 are still teaching one year after qualification", that "Three quarters (75.8%) of teachers who qualified three years ago are still teaching" and that "Two thirds (67.4%) of teachers who qualified five years ago are still teaching".
Whatever you think of the level, look at the form of the reporting. It is a survival curve by cohort, not one annual percentage, so you can see where in a career the losses fall. Build the same thing for your own starters: of the people who joined in each quarter, what share is still here at six months, one year, two years and three. The curve tells you which intervention to buy. A cliff at four months is an onboarding and recruitment problem. A cliff at eighteen months is a progression problem. One annual rate hides both.
One manager
In most organisations with high turnover, a disproportionate share of resignations comes from a small number of teams, and the common factor is the person running them. This is uncomfortable, which is why the analysis often stops just short of it.
Run the numbers anyway. Resignations per manager, normalised for team size, over two or three years so that one bad quarter does not convict anybody. Then look at what else is true of the outlier teams: cancelled one-to-ones, reviews late in every cycle, grievances, internal transfer requests out. A manager who is producing turnover is usually producing three other signals first.
The response is rarely dismissal. More often somebody was promoted for being good at the work and has never been shown how to hold a one-to-one, give difficult feedback or deal with a performance problem. That is a training and supervision gap, and it is cheaper to fix than to keep recruiting around.
One shift pattern, one site
Where work runs across rotas, sites or shifts, turnover concentrates in whichever pattern is hardest to live with: nights, split shifts, short-notice rostering, the depot with the worst commute, the site with no parking. People do not leave because of the work. They leave because the schedule makes the rest of their life unmanageable, and because the pattern was fixed for the convenience of the rota rather than negotiated.
Some of the response here is a legal entitlement rather than a perk. In the United Kingdom, GOV.UK states that "All employees have the legal right to request flexible working" and that "Employees can make a request for flexible working from their first day in a job". If your high turnover sits in one rota, find out how many requests that group has made, how many were granted and how long they took. This is general information about the position in the United Kingdom and not legal advice; take advice on your own circumstances.
One pay band
The last concentration is a band, usually the one just above entry level, where people have become competent and are still paid as though they were new. The signal is not that pay is low in general. It is that leavers from one band go to directly comparable jobs for materially more, and that the internal gap between that band and the one above cannot be explained to the people in it.

Four of these five concentrations are visible in data you already hold. The fifth, pay, needs destination information, which means asking leavers where they went and recording the answer.
What causes high turnover: the causes evidence supports
With the concentration found, the causes become specific rather than philosophical. These are the ones that recur, in roughly the order in which they show up in real leaver analysis.
The job was different from the advertised job. Hours, travel, autonomy, the share of the week spent on the tedious part. This produces early leaving almost exclusively, and it is caused upstream, in the advert, the interview and what the hiring manager promised.
The manager. Not personality, usually. Absence of the ordinary management mechanics: no regular one-to-one, no feedback until the annual review, no response to a raised problem, inconsistent treatment across the team.
Pay that is unexplained rather than low. The sense of unfairness does more damage than the level. ACAS guidance on performance-related pay makes the mechanism explicit: it says "The process for deciding this should be fair and objective", and warns that where workers perceive unfairness they risk becoming "less motivated, dissatisfied at work, more likely to leave".
No visible next step. People leave to get a promotion you could have given them, because nobody could tell them what the next role required or when it might exist. This causes the eighteen-month to three-year cliff.
Workload and the rota. Sustained overload, short-notice changes, and no slack. Then the first person leaves, their work is absorbed by the others, and the cause reproduces itself. Overloaded teams generate more turnover, which generates more overload.
Being asked and then ignored. Consultation that goes nowhere is worse than no consultation, because it teaches people that nothing moves. ACAS puts the positive case plainly: "Consultation helps with good employment relations as it includes employees and their representatives in the decision making process", and notes that employees are "much more likely to support changes if they understand the reasons behind the proposals".
A labour market that makes leaving easy. Real, and the part you do not control. Published context beats guesswork: the ONS Labour market overview, UK of 20 October 2026 reports that "The estimated number of vacancies in the UK decreased in the latest quarter. Early estimates for July to September 2026 suggest a decrease of 21,000 (2.9%) to 691,000, compared with April to June 2026". A tightening or loosening market moves everyone's turnover in the same direction, which is a reason to watch your own trend rather than treat every movement as something you did.
The causes managers assume, and what to check first
Four explanations arrive before any analysis does. None is worthless, and each is usually a way of locating the cause outside the room.
"It is pay." Sometimes it is. Before you accept it, check two things: whether leavers from the affected group actually went to higher-paid comparable work, and whether the group can explain how their pay was decided. If destinations are lateral, the problem is not the level. Pay rises are also the most expensive intervention available and the hardest to reverse, which is a reason to be sure rather than quick.
"It is the market." Partly, and it affects your competitors equally. If one of your eleven teams produces half the resignations, the market did not do that. The market sets the floor; the concentrations are yours.
"It is this generation." Age bands mostly track tenure and pay band, and the people in the affected band are younger because the band is junior. Control for tenure before concluding anything about age, and be careful with the inference in any case, since treating people differently because of age is a legal question in the United Kingdom as well as an analytical one. This is general information, not legal advice.
"They were never going to stay." Occasionally true, for genuinely transitional roles. It becomes a problem when it is applied to every leaver, because it converts a measurable pattern into an unfalsifiable belief and ends the investigation.
A practical rule: no cause gets accepted until somebody has stated it as a testable sentence with a number attached. "Band 3 leavers are going to competitors for 12% more" can be checked. "People want more money" cannot.
How to reduce employee turnover: match the response to the cause
Reducing staff turnover is not one project. It is five or six small ones, each aimed at a concentration you have already located, and the cheap, fast interventions are also the ones with the clearest effect.
- Fix the advert and the interview. Write what the job is actually like, including the hours, the rota and the dull third of the week. You will lose some applicants, which is the mechanism working. This is the only intervention that reduces early turnover at zero cost.
- Make the first ninety days a managed process. A named buddy, a thirty, sixty and ninety day conversation, equipment and access ready on day one, and early goals that somebody actually reviews. Our 30, 60, 90 day plan post sets out the structure.
- Put the ordinary management mechanics in place, and check they happen. A one-to-one that does not get cancelled, feedback inside the week rather than at the annual review, and a response to raised problems. Visibility of whether these happen is usually the missing part. See how New Dynamics continuous feedback keeps that record between managers and their teams.
- Train the outlier managers. How to run a one-to-one, give difficult feedback and handle a performance problem early. Supervise the outcome, do not just book the course.
- Publish the progression framework. What the next role requires, who decides and when. Our post on the career progression framework covers how to build one.
- Explain pay before you change it. A published basis for pay decisions, consistently applied, addresses the unfairness that drives leaving. Change the level where destination data says you are behind in one band, and change it for the band rather than for whoever asked.
- Negotiate the rota rather than issuing it. Handle flexible working requests properly and quickly, and look at the patterns in the group that is leaving.
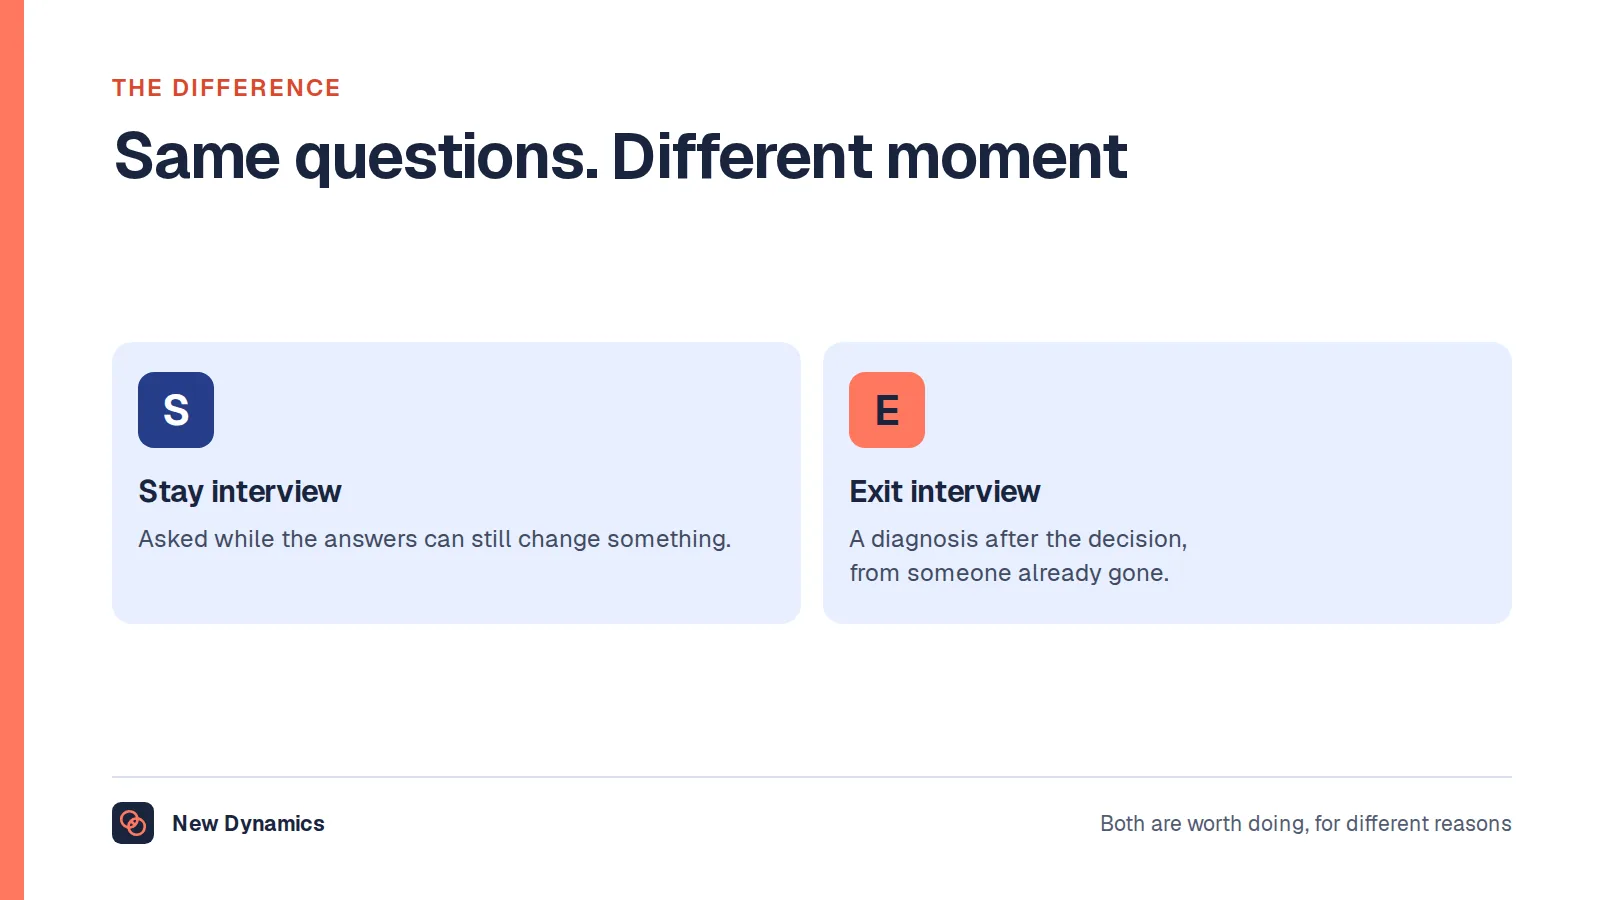
- Ask the people who are still here. Stay interviews get you the same information as an exit interview while it can still change the outcome, and exit interview questions still matter for the pattern across many leavers.
Make one person accountable for each item, with a measure that is not the overall turnover rate: ninety-day survival, resignations per manager, the share of one-to-ones actually held, internal moves as a share of all moves. The headline rate moves slowly and last, and judging a six-week-old intervention by it will persuade you that nothing works.
What not to do
Five responses are common, expensive and mostly ineffective.
A retention bonus to fix a management problem. A payment conditional on staying another six months buys you six months, from everybody including the people who were never leaving, and teaches the rest that announcing an intention to resign is how you get paid. Retention payments have a narrow legitimate use: holding named people through a defined event, such as a system migration or a site closure, with an end date. They treat no cause, and where the cause was perceived unfairness in pay, an ad hoc payment to some people makes it worse.
An exit survey nobody reads. Collecting leaver reasons into a form that is never analysed by team, tenure or manager produces an annual slide saying "career development" and no action. If nobody owns the analysis, stop running the survey and hold a conversation instead.
Counter-offering as a retention strategy. It keeps the individual for a while, moves pay outside the framework, and signals a route to a rise. Decide in advance which roles justify it and what the limit is.
Recruiting faster instead of leaving less. Reducing time to hire makes high turnover affordable rather than smaller. Worth doing, but not an answer.
Renaming the measure. Switching from turnover to attrition, or excluding fixed-term endings, does not change how many people left. It only makes next year incomparable with last year.

One more, less obvious: do not commission an engagement survey as the diagnosis when the data you need is already in the HR system. Tenure, team, manager and leaving date will locate the problem this week. A survey adds a month and a response rate.
Low staff turnover is not automatically good
The symmetry is worth stating, because organisations sometimes solve high turnover into a different problem.
Very low turnover can mean a settled, well-managed workforce. It can also mean nobody can leave, because the local labour market offers nothing, because skills have become too specific to be portable, or because pay above the market has made leaving irrational while doing nothing about the work. It can mean promotion blockages, with capable people waiting years for a post to clear, and it can mean poor performance is tolerated because nothing moves, including the people who should.
The useful questions are the same ones in reverse. Who is staying, and did you want them to? Is anybody being promoted? Some turnover is how an organisation refreshes itself, and a reduced staff turnover figure achieved by closing every exit is not a success.
A thirty-day diagnosis
If you have a high figure and a meeting in a month, this is the sequence that produces something defensible.
- Week one. Write the leaver rule and the denominator, recalculate three years on it, and split the result by tenure, team, manager, site, shift and pay band.
- Week two. Build the survival curve by joining quarter and find the cliff. Cost the role with the worst concentration and multiply by its leavers.
- Week three. Three stay interviews in that team, a read of its exit records, and a count of its one-to-ones, late reviews and flexible working requests.
- Week four. One page: the concentration, the cause as a testable sentence, two interventions, their cost, a measure for each and the date you will next look.
That page is a better paper than any benchmark comparison, because every line is about your own organisation and every line can be checked. Our HR metrics post covers reporting the definition beside the number.
Frequently asked questions
What does high turnover mean?
High turnover means people are leaving and being replaced fast enough that it costs the organisation something it notices: recruitment spend, lost output, overloaded teams, or the loss of people it wanted to keep. It is a judgement rather than a threshold, because the same percentage can be routine in seasonal work and alarming in a specialist team.
What is considered a high turnover rate?
There is no official answer. No United Kingdom source, including the ONS, GOV.UK and ACAS, publishes a target or acceptable turnover rate, and rates differ so widely by sector that a single threshold could not serve them. Judge your rate against your own history on an unchanged definition, against published figures whose method you can read, and against what the leaving costs you.
What causes high employee turnover?
The recurring causes are the job turning out to be different from the advertised job, the absence of ordinary management mechanics such as regular one-to-ones and timely feedback, pay that cannot be explained rather than pay that is simply low, no visible next step, and workload or rota patterns people cannot plan around. A loose labour market makes all of them easier to act on.
How do you reduce employee turnover?
Find the concentration first, then match the response to it. Early leaving is treated by honest adverts and a managed first ninety days. One manager's team is treated by training and supervision. A cliff at two years is treated by a published progression framework. Pay is treated by explaining the basis for decisions and correcting one band where destination data shows you are behind.
Is high attrition the same as high turnover?
In everyday use, yes. Most people and most HR systems use attrition rate and turnover rate interchangeably for leavers divided by employees. In its strict sense attrition means leavers who are not replaced, so headcount falls, which is a different event. State which you mean beside the number.
Is low staff turnover always a good sign?
No. Low turnover can mean a settled workforce, and it can also mean people have nowhere to go, that promotion is blocked, or that poor performance is tolerated because nothing moves. Ask who is staying, whether you wanted to keep them, and when somebody was last promoted.
Your next step: find the concentration, then spend
- Recalculate the last three years on one written definition, then split the result and find the cliff in your survival curve.
- Cost the worst-affected role, so the next conversation has a cash figure in it.
- Run three stay interviews in that team this month, and check how many one-to-ones it actually held.
- Write the one-page diagnosis, and name an owner and a measure for each intervention.
For the practices behind the fixes, read and download our employee retention guide. The guide is free to read, and the PDF uses our short download form.
Want leaver data, one-to-ones, early goals and the reasons behind all three in one place? Book a New Dynamics demo and bring last year's leaver list. You can also email contact@new-dynamics.com.