TL;DR
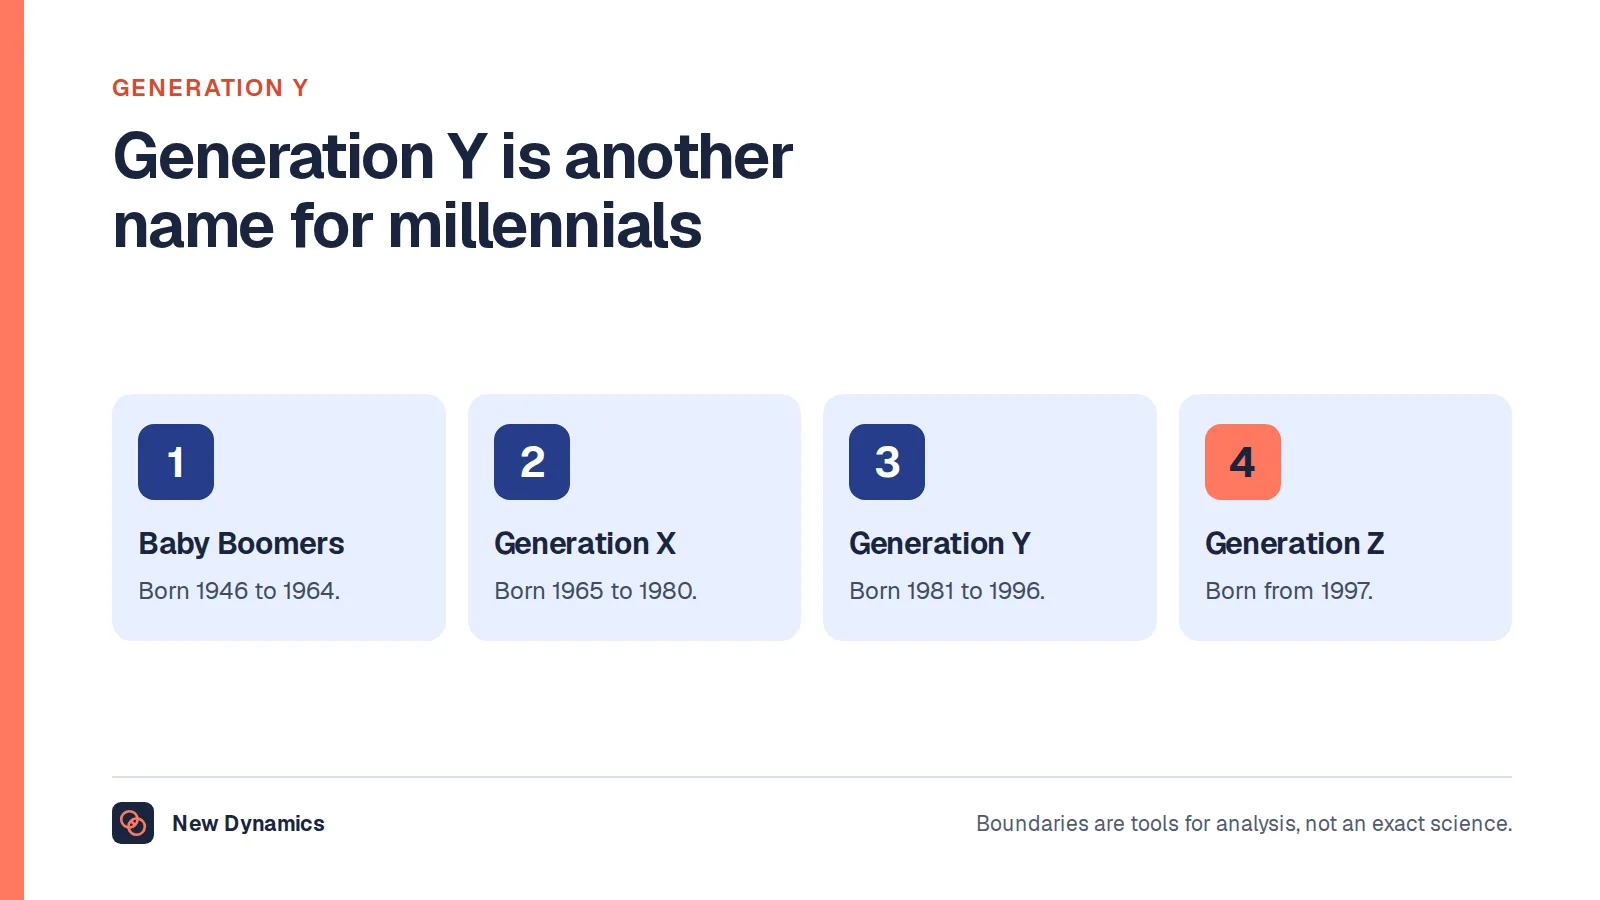
- The generation labels are conventions set by researchers and the media, not official definitions. Boomers are usually counted from 1946 to 1964, Gen X from 1965 to 1980, Gen Y or millennials from 1981 to 1996 and Gen Z from 1997, and different sources draw the lines in different places.
- The published age data is far more useful than the labels. DWP puts the employment rate for people aged 50 to 64 at 72.2% for April to June 2026, against a 12.9 percentage point gap with those aged 35 to 49, and ONS counted 981,000 young people aged 16 to 24 who were NEET in the same quarter, a rate of 13.0%.
- Using a generation label in a hiring, development or redundancy decision means using age, and age is one of the nine protected characteristics under the Equality Act 2010. Ask about the actual preference, design for life stage and check your own data by age band.
Ask a room of managers which generation a colleague belongs to and you will get an answer in a few seconds. Ask what that answer tells them about how to manage the person, and the room usually goes quiet. That silence is the correct response, and this article is about why.
Two things follow. First, the birth-year ranges, set out plainly, because that is what most people searching for this actually want. Second, the part that matters if you make decisions about other people's work: what those ranges can and cannot tell an employer, what the published figures say about the age structure of the UK workforce, and why reaching for a generation label when you hire, promote, train or make redundancies is a legal risk as well as a management error.
The reliable way to learn what someone needs at work is to ask them, and to keep asking. See how New Dynamics continuous feedback makes that a routine habit rather than an annual event.
Generation birth years, set out plainly
Here are the ranges you will see most often, with the ages each one reaches during 2026.
| Label | Birth years commonly used | Age during 2026 |
|---|---|---|
| Baby boomers | 1946 to 1964 | 62 to 80 |
| Generation X | 1965 to 1980 | 46 to 61 |
| Generation Y (millennials) | 1981 to 1996 | 30 to 45 |
| Generation Z | 1997 to about 2012 | 14 to 29 |
| Generation Alpha | about 2013 onwards | under 14 |
So the quick answers run like this. Generation X comes after the baby boomers and before Generation Y, which is the same group as the millennials. Generation Z follows, and is informally nicknamed the zoomers. Someone born in 1967, 1968 or 1970 sits in Generation X. Someone born in 1960 is a boomer. Someone born in 2009 is in Generation Z. Our separate article on Generation Y, its meaning and characteristics goes into that cohort in detail, including the exact wording Pew Research Center uses for its boundaries.
The name "Generation X" is usually credited to Douglas Coupland's 1991 novel Generation X: Tales for an Accelerated Culture, which put the phrase into common use. Y and Z then simply followed X through the alphabet, which is the whole of the reasoning behind two of the most confidently discussed categories in modern management.

These boundaries are conventions, not definitions
This is the single most important thing to understand before you use any of it. No UK government department defines these groups. The ranges above are conventions adopted by research organisations, publishers and the media, and they vary. You will find Generation X beginning in 1961, 1964 or 1965 depending on the source, Generation Y starting anywhere from the late 1970s to 1982, and Generation Z ending in 2010 or 2012 or with no end date at all. Pew Research Center, whose millennial boundary is the most widely copied, is explicit that generational cut-offs are not an exact science and should be treated as tools.
Treat none of the ranges above, including ours, as authoritative. If a source gives you a birth range to the year with no acknowledgement that others differ, that is a sign to be careful with everything else it tells you.
Two related questions come up often enough to answer directly. People born in the 1960s straddle a boundary: the first half of the decade is usually counted as boomers and the second half as Generation X, which is why "what are people born in the 60s called" has no single answer. And "Gen C", which appears in marketing writing as the connected or the COVID generation, has no settled birth range and no official definition that we are aware of. It is a coinage, not a cohort.
The age structure of the UK workforce, in published numbers
Here is the honest alternative to generational thinking. The age profile of the UK workforce is measured, published quarterly and free to read, and it tells you far more than a birth-year label ever will.
The workforce overall. ONS put the employment rate for people aged 16 to 64 at 75.3% for June to August 2026, in Labour market overview, UK: October 2026, published on 20 October 2026. The same release put the unemployment rate for people aged 16 and over at 4.7% and economic inactivity for those aged 16 to 64 at 20.9%. For the breakdown by age band, ONS publishes Dataset A05 SA: Employment, unemployment and economic inactivity by age group, which it describes as "Employment, unemployment and economic inactivity levels and rates by age group, UK, rolling three-monthly figures, seasonally adjusted". It was released on 20 October 2026, with the next release due on 17 November 2026.
Workers aged 50 and over. The Department for Work and Pensions publishes an annual analysis of this group. Its Economic labour market status of individuals aged 50 and over, trends over time: September 2026, published on 24 September 2026 and using Labour Force Survey data for April to June 2026, reports that "The employment rate for people aged 50 to 64 years was 72.2% in 2026". It puts the gap with people aged 35 to 49 at 12.9 percentage points, down from 14.1 percentage points the year before, which places the 35 to 49 rate at 85.1%. The release attributes the narrowing gap to more people aged 50 to 64 working, rather than to fewer younger people working.
The same analysis shows how sharply State Pension age bites: "In 2026, at age 65 years, the employment rate was 46.6%, which then decreased at age 66 years to 33.1%." DWP describes the effect as statistically significant, with the employment rate falling by 13.5 percentage points from 65 to 66 and the inactivity rate rising by a similar 13.8 percentage points. That is not a generational trait. It is a policy threshold, visible in the data as a cliff edge.
Young people out of work and out of study. This is the sourced answer to the searches about a Gen Z job crisis. In Young people not in education, employment or training (NEET), UK: August 2026, released on 27 August 2026, ONS reports that "There were an estimated 981,000 young people aged 16 to 24 years in the UK who were NEET in April to June 2026", and that "The percentage of all young people in the UK who were NEET in April to June 2026 was 13.0%". The release separates those who are unemployed from those who are economically inactive, which matters, because the two groups need different things.
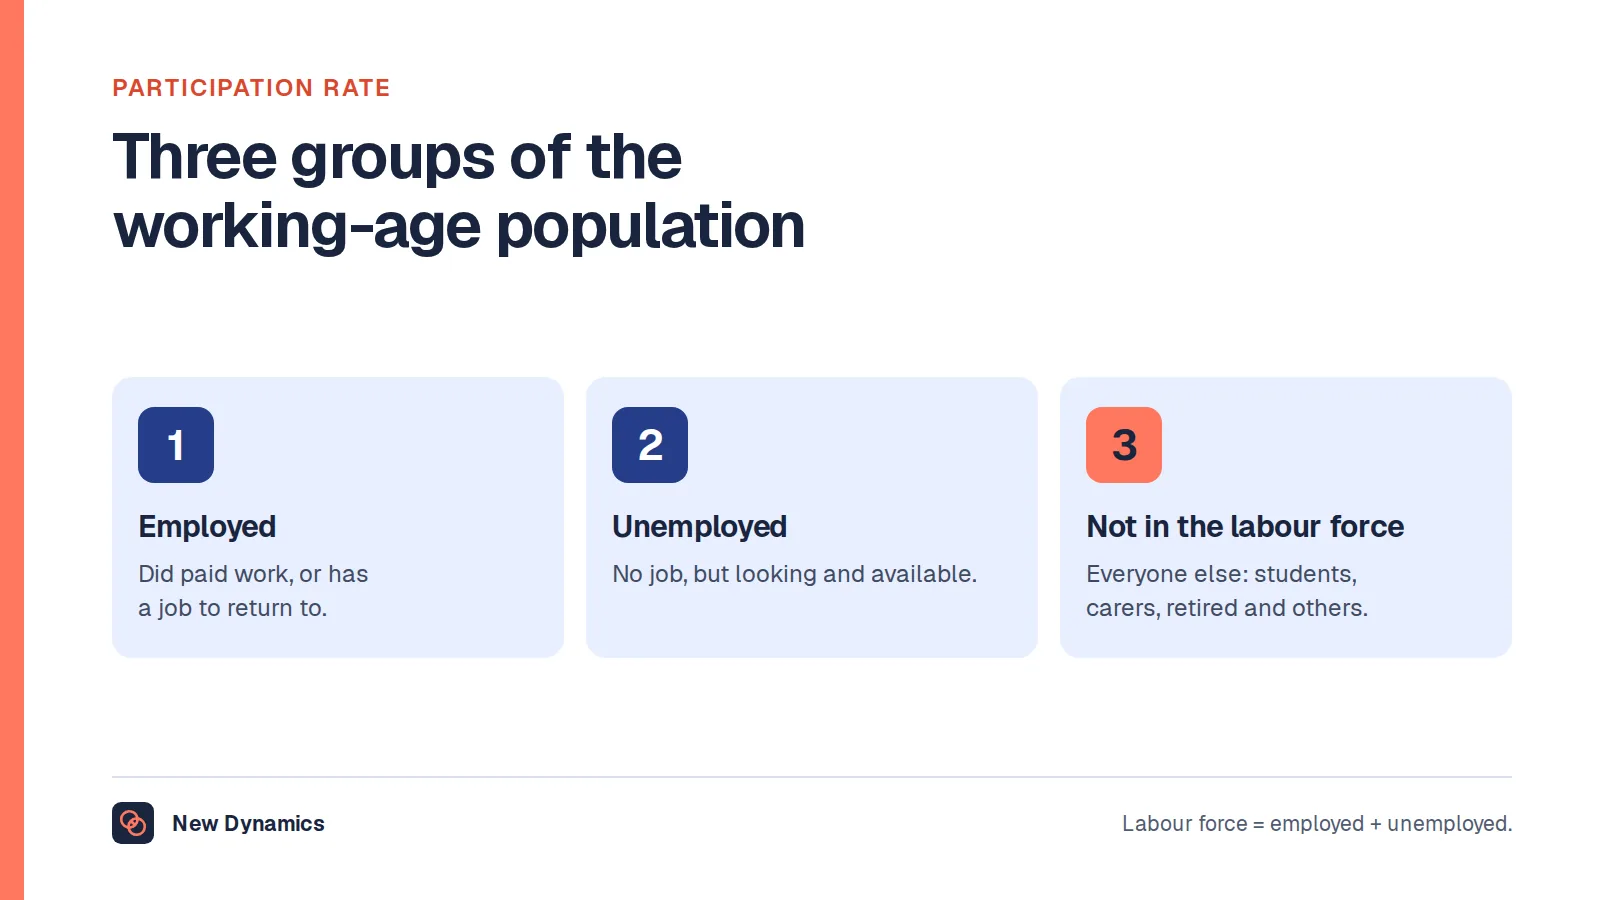
Notice what these three sources have and generational commentary does not: a defined population, a reference period, a measured rate and a known margin of error. Our statistics hub collects the figures we use across the site, and our explainer on the labour force participation rate covers how these measures are constructed.

What the labels are actually good for
They are not worthless. Used carefully, a cohort label points at shared formative conditions: the technology that existed when someone was learning to work, the state of the labour market when they first looked for a job, the housing costs they faced in their twenties. Those conditions are real and they leave traces. Someone who entered work in 2009 met a very different market from someone who entered in 2021.
That is the limit of it. Three problems make the labels close to useless for any individual decision.
The groups are enormous and internally varied. A span of fifteen to eighteen birth years covers millions of people with nothing much in common beyond a decade. The differences within any generation are routinely larger than the differences between generations.
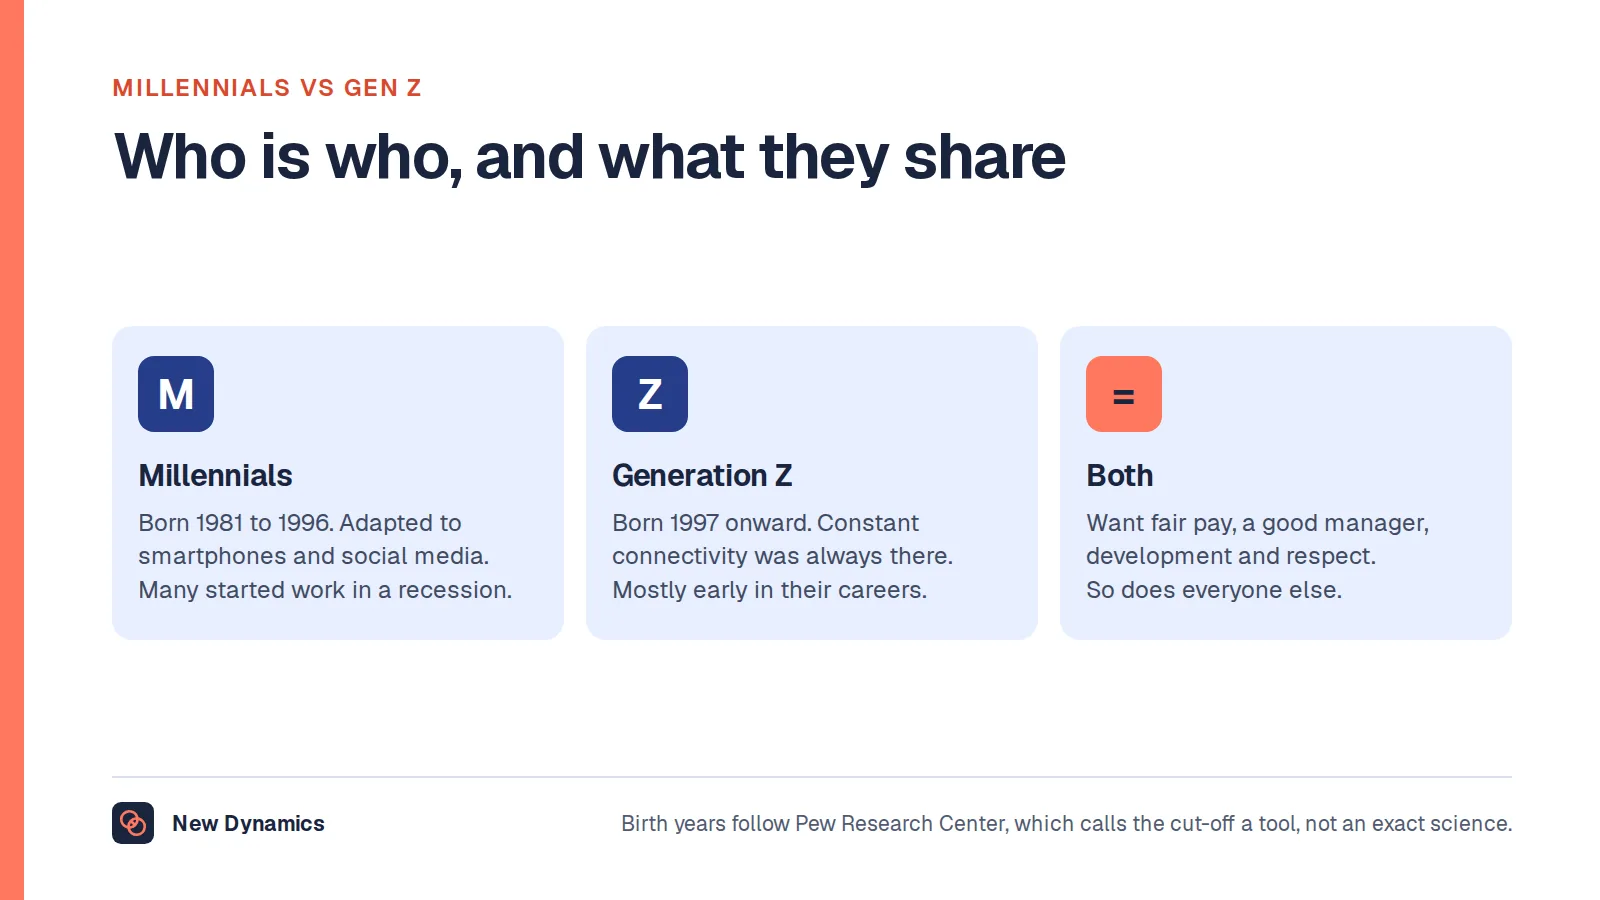
Age gets mistaken for generation. Most workplace claims about generations are really observations about age. People new to work need clearer expectations and more frequent feedback, because they are new, not because of the year they were born. People in their late thirties and forties want flexibility, because that is when caring responsibilities peak. Compare any two generations at a single moment and you cannot separate the cohort effect from the life-stage effect at all. We work through the specific case of the two youngest working cohorts in millennials vs Gen Z at work.
The commentary is largely unverified. Lists of boomer characteristics or Gen Z traits circulate without sources, surveys with no published method, or vendor research designed to sell training. Before repeating a generational claim, ask which population was measured, when, and against what comparison. Most of the time there is no answer.
Where generational thinking becomes age discrimination
Treating someone differently because of their generation is treating them differently because of their age, and in Great Britain that is regulated.
Acas is direct about the law. Its guidance on age discrimination states that "Age is one of 9 'protected characteristics' covered by discrimination law (Equality Act 2010)", that "Age discrimination includes direct and indirect discrimination, harassment and victimisation", and that "Age discrimination can happen to people of any age". The protection is not reserved for older workers. It covers employees, job applicants, former workers, and contractors and self-employed people hired to personally do the work.
On the general principle, Acas guidance on discrimination and the law explains that "Discrimination means treating someone 'less favourably' than someone else, because of" a protected characteristic. It describes direct discrimination as "Less favourable treatment directly because of a protected characteristic", and indirect discrimination as "When everyone's treated the same but people with a protected characteristic are put at a disadvantage".
Put those two definitions next to the way generation labels are actually used and the exposure is obvious.
- "We want a digital native for this role." That is a proxy for a birth year, in a job advert.
- "He is a boomer, he will not pick up the new system." That is a training decision made on age.
- "She is a bit young to lead that account." That is a promotion decision made on age.
- "Our team needs a younger feel." That is a redundancy or recruitment criterion made on age.
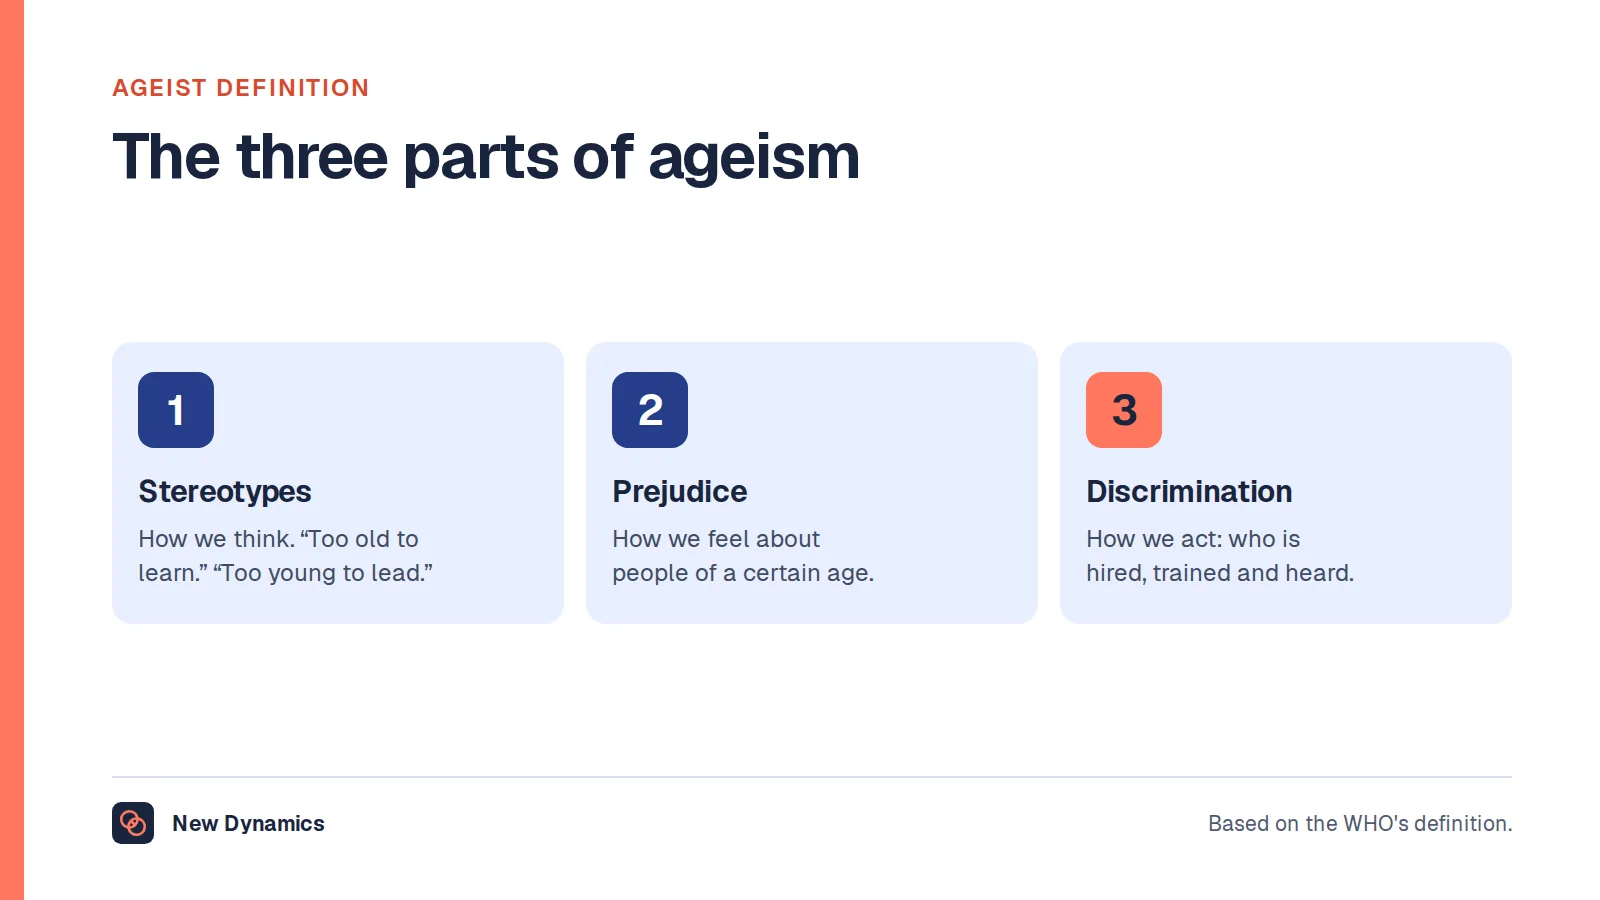
Indirect discrimination is the subtler risk, because the rule looks neutral. A requirement for recent graduate status, a maximum number of years of experience, a selection matrix that quietly rewards continuous service, or a culture-fit interview question about social habits can all put one age group at a disadvantage while appearing to treat everyone the same. Our plain explainers on the definition of ageism and the definition of discrimination at work set out the terms, and unconscious bias examples covers how these assumptions surface in practice. This article is general information and not legal advice.
The practical test is simple. Write down the reason for your decision. If the reason refers to age, a generation, a decade or a proxy for any of them, you do not yet have a defensible reason. Go and find the evidence about the work.
What to do instead of generational thinking
- Ask about the actual preference. "How do you like to receive feedback?" and "What gets in the way of your best work?" take thirty seconds and replace an entire genre of commentary. The answers will not sort neatly by birth year.
- Design for life stage and circumstance, not birth year. Caring responsibilities, a long commute, a health condition, a mortgage, a first job, a phased retirement: these are what shape what people need, and none of them maps onto a cohort. A 28-year-old and a 47-year-old new parent have more in common with each other than either has with a same-aged colleague in different circumstances.
- Offer choice rather than assuming a default. Different communication channels, working patterns, learning formats and kinds of recognition, available to everyone, with nobody having to explain why they are asking.
- Check your own data by age band. Look at applications, offers, promotions, access to training, performance ratings and redundancy selections by age band, and ask about any gap you cannot explain by the work. Use bands wide enough to protect anonymity, suppress small cells, and look at the trend rather than one quarter. This is the step most employers skip, and it is the one that would actually tell them whether age is affecting outcomes. Our note on strategic workforce planning covers how age-band analysis feeds into capacity and succession work.
- Fix the language. "Typical millennial" and "OK boomer" are age stereotypes, however lightly meant, and they set the tone for the decisions that follow.

Frequently asked questions
What are the birth years for Gen X, Gen Y and Gen Z?
The ranges most commonly used are 1965 to 1980 for Generation X, 1981 to 1996 for Generation Y or millennials, and 1997 onwards for Generation Z, which some sources end around 2012. Baby boomers are usually counted from 1946 to 1964. These are conventions adopted by researchers and the media, and different sources use different years.
Is there an official definition of each generation?
No UK government department defines them. The boundaries come from research organisations and publishers, they disagree with one another, and the organisations that set the best-known ones describe them as analytical tools rather than exact categories. Nobody born a year either side of a boundary changed in any way.
What generation am I if I was born in 1967 or 1970?
Both years fall inside Generation X on the ranges in widest use, which run from 1965 to 1980. Someone born in 1960 would usually be counted as a baby boomer, and someone born in 2009 as part of Generation Z. Because the start and end years vary between sources, people born close to a boundary often identify with both groups.
Is there really a Gen Z unemployment crisis?
The sourced figure is this. ONS reported an estimated 981,000 young people aged 16 to 24 in the UK who were NEET, not in education, employment or training, in April to June 2026, a rate of 13.0%. That is a serious number and it deserves a serious response, but it describes an age group in a labour market, not a generational character flaw.
Can we use generations in hiring or redundancy decisions?
Treat that as unsafe. Acas states that age is one of the nine protected characteristics covered by the Equality Act 2010, and that age discrimination can happen to people of any age. A decision justified by a generation label is a decision justified by age, which includes job adverts asking for digital natives and selection criteria that disadvantage one age group while looking neutral.
What should we do instead of generational analysis?
Three things. Ask each person what they prefer and act on the answer. Design policies around life stage and circumstance rather than birth year. And analyse your own hiring, development and exit data by age band, using bands wide enough to protect anonymity, so you find out whether age is affecting outcomes at your organisation rather than guessing from a trend piece.
Your next step: swap one label for one number
- Pick one people process: shortlisting, access to training, or redundancy selection.
- Pull the outcomes by age band, in bands wide enough to keep individuals anonymous.
- Write down any gap you cannot explain by the work itself, and find out why.
- In your next one-to-one, ask the question you would otherwise have assumed the answer to.
For a practical framework covering fair hiring, development and everyday practice, read and download our diversity and inclusion guide. The guide is free to read, and the PDF uses our short download form.
Want feedback, goals and reviews that fit the person rather than the cohort? Book a New Dynamics demo and bring a decision you are unsure about. You can also email contact@new-dynamics.com.