TL;DR
- eNPS stands for employee net promoter score. One question on a 0 to 10 scale sorts answers into promoters (9 and 10), passives (7 and 8) and detractors (0 to 6). The score is the percentage of promoters minus the percentage of detractors, so it runs from minus 100 to plus 100.
- The arithmetic hides the distribution. Two organisations can both score plus 16 while one has 26 per cent detractors and the other has 38 per cent. With a small headcount the number is unstable: one person moving from promoter to detractor shifts the score by 200 divided by the number of responses, which is 16.7 points in a team of 12.
- No official United Kingdom source publishes an eNPS benchmark, so every good eNPS figure in circulation comes from a vendor's own customer data. What is sourceable is the anonymity rule: the ICO states that anonymous information does not relate to an identifiable person “either in isolation or when combined with information from other sources”.
Someone has sent round a number. It is plus 16, or minus 4, or plus 41, and the note says it is the eNPS. The next question is always whether that is good. Answering it requires knowing how the number was built, because the arithmetic throws away more than most people realise.
This article covers the exact calculation with an example you can check, what the single number discards, and what to pair it with.
A score is an invitation to ask why. See how New Dynamics continuous feedback keeps the comments behind a number visible all year, rather than once a quarter. If you are designing the survey rather than reading one number from it, our post on the workplace engagement survey covers the question bank and the reporting threshold.
What eNPS means
eNPS stands for employee net promoter score. It is a single-question measure borrowed from customer research, where the net promoter score asks how likely a customer is to recommend a company. The employee version turns the question inward. The usual wording is a variation of: how likely are you to recommend this organisation as a place to work, on a scale of 0 to 10, where 0 is not at all likely and 10 is extremely likely.
One thing is worth saying at the start. eNPS is a commercial metric, not an official statistic. It was devised and popularised by consultants and survey vendors, and no government department, regulator or national statistics body defines it, collects it or publishes it. That does not make it useless. It does mean there is no authority to appeal to when somebody asks what the right answer is.
The three bands
Every answer falls into one of three groups, and the boundaries are fixed by convention rather than by any standard body:
- Promoters: people who answer 9 or 10.
- Passives: people who answer 7 or 8.
- Detractors: people who answer 0 to 6.
The bands are not equal. Of the eleven possible answers, seven count as detraction, two as passive and two as promotion. A 6 out of 10, which most people would read as middling, counts against you as heavily as a 0. The asymmetry is deliberate in the original customer research, on the argument that only an enthusiastic recommendation carries value. It explains why eNPS looks harsh next to a five-point agreement scale run on the same people.

How to calculate an eNPS score
The formula is:
eNPS = percentage of respondents who are promoters, minus percentage of respondents who are detractors.
Three details matter in practice:
- Passives count in the denominator but not in the subtraction. They dilute both percentages without contributing to either. Dropping them from the denominator inflates the score.
- The denominator is responses, not headcount. Divide by the number who answered, not the number you asked.
- The result is a number, not a percentage. It is the difference between two percentages, so calling it a percentage invites people to read plus 16 as sixteen per cent of something.
Because each share can run from 0 to 100, the score runs from minus 100 (everyone answered 6 or below) to plus 100 (everyone answered 9 or 10). Zero means promoters and detractors balance exactly.
A worked example you can check
An organisation of 400 people asks everyone, and 250 answer, a response rate of 62.5 per cent.
| Band | Answers | Responses | Share |
|---|---|---|---|
| Promoters | 9 and 10 | 105 | 42.0% |
| Passives | 7 and 8 | 80 | 32.0% |
| Detractors | 0 to 6 | 65 | 26.0% |
| Total | 250 | 100% |
- Promoters: 105 divided by 250 is 0.42, so 42 per cent.
- Detractors: 65 divided by 250 is 0.26, so 26 per cent.
- eNPS: 42 minus 26 equals plus 16.
The three shares add to 100 per cent. That is the check worth doing every time. If they do not add up, somebody has mislabelled a band or dropped the passives from the denominator.

What the single number throws away
Now a second organisation, also with 250 responses: 135 promoters (54 per cent), 20 passives (8 per cent) and 95 detractors (38 per cent). Its eNPS is 54 minus 38, which is plus 16. Identical to the first.
The two places are not remotely similar. The second has 95 people who would not recommend working there against the first organisation's 65, and almost nobody in the middle. It is a polarised workforce, probably with a team or two in real difficulty, and the headline score says nothing about it. Subtraction is lossy, so publish the three shares alongside the score. A score reported alone cannot be interrogated.
Why a small headcount makes the number unstable
With few responses each person carries a large weight, and the arithmetic of that is exact. If one respondent switches from promoter to detractor, the promoter share falls by one divided by the number of responses and the detractor share rises by the same amount. Both moves push the score the same way, so it shifts by 200 divided by the number of responses.
In the example above, one person moving costs 0.8 of a point, which is noise. In a team of 12 where everyone answers, it costs 16.7 points. A team that scored plus 17 last quarter and 0 this quarter may have had exactly one person change their mind by one point.
So do not report eNPS for groups small enough that one answer moves it visibly, and do not build a target or a bonus on it. For healthy response rates and the two UK engagement scores that genuinely are published, see our post on the employee engagement benchmark.
There is no official UK eNPS benchmark
This is where most writing on the subject goes wrong, so here it is plainly. No United Kingdom government department, regulator or national statistics body publishes an employee net promoter score, a target eNPS, or a distribution of eNPS by sector or size. We looked in order to write this article, and there is nothing to cite.
Every figure presented as a good eNPS, or an industry average, comes from a survey vendor's own dataset. Those datasets share three problems:
- Self-selected customers. The population is the organisations that bought one tool and chose to run this question. That is not a sample of employers.
- Undisclosed composition. The size, sector and country mix behind the average is usually unpublished, so you cannot tell whether you resemble it.
- Variable wording. Move the question from recommending the workplace to recommending the products, or move a band boundary, and the number changes.
The useful version of eNPS is longitudinal: same wording, same scale, same population definition, compared only with your own previous rounds. Our HR metrics post applies that discipline to the rest of the people numbers, and the HR statistics hub collects the UK figures that do have a published source.
What to pair it with
eNPS is one question. Alone it gives the temperature and nothing about the cause.
A free-text follow-up, asked immediately. The most valuable field in an eNPS survey is the box after the number: what is the main reason for your answer. The score tells you how many. The comments tell you what, and only the second is actionable. Given a choice between ten more rating questions and reading every comment properly, read the comments.
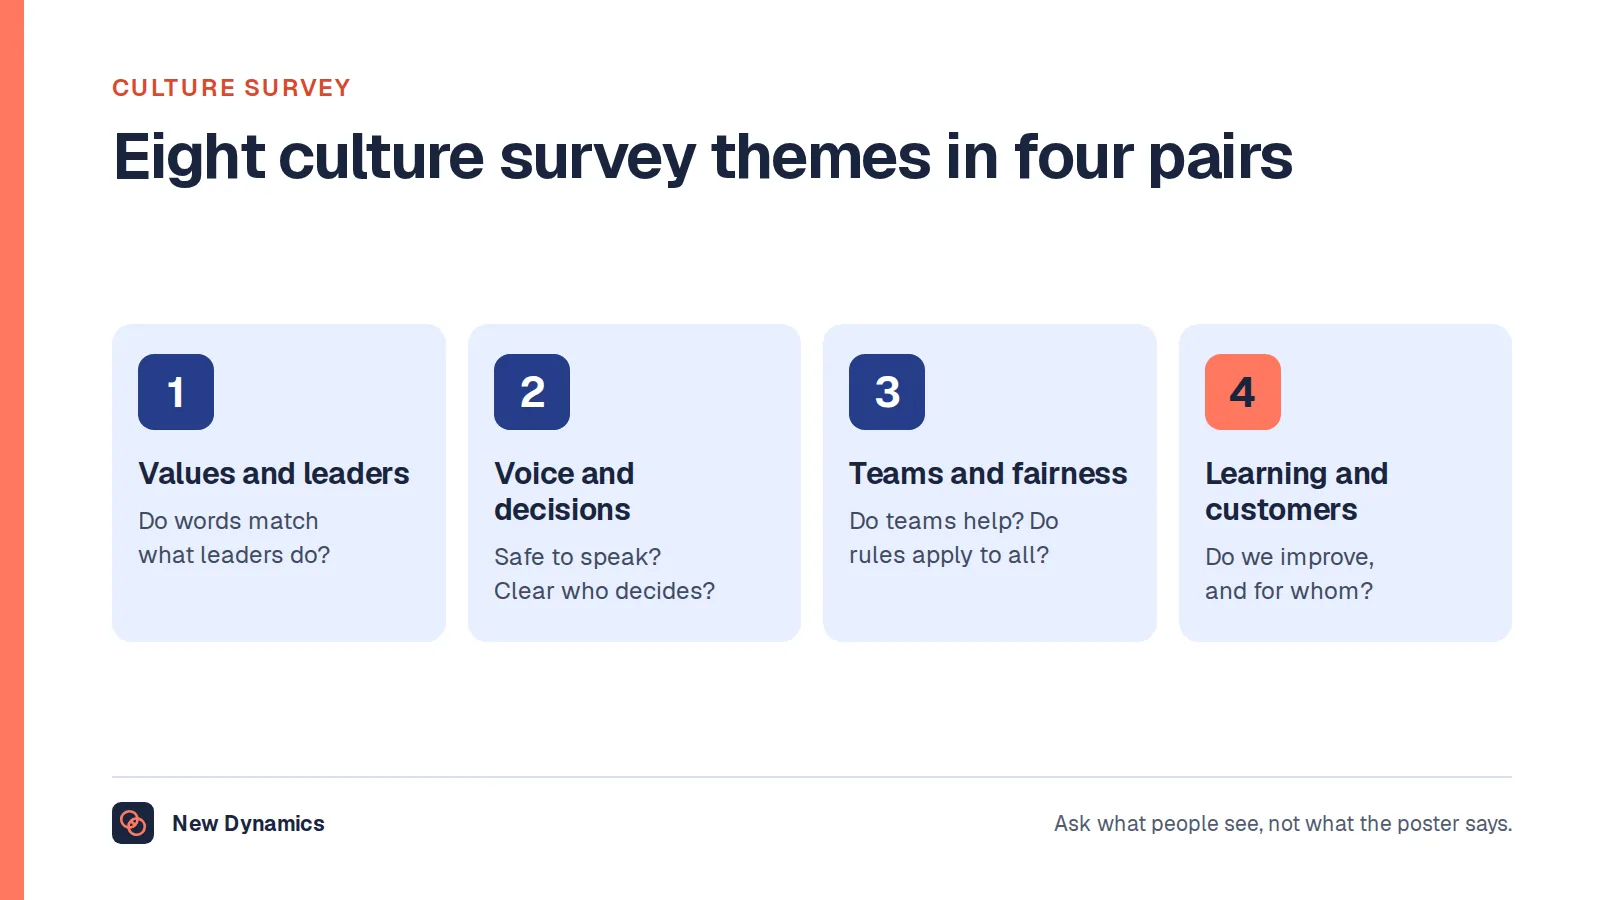
A small, stable set of driver questions. Workload, manager support, clarity of direction, fairness of reward, and whether anything happened after the last survey. These produce the recommendation, and they are what you can change. Our employee survey questions post has a bank to pick from, and the culture survey questions post covers whether people feel able to speak up.
A segment view, subject to a minimum group size. The spread between teams, sites and lengths of service is usually more interesting than the organisation-wide figure, which routinely conceals one team in trouble.

Response rate and anonymity
A score built on a low response rate is a score built on the people who still believe answering matters. That group is not a random sample, and it tends to skew towards the two ends. Report the response rate next to the score, and treat a falling rate as the more serious of the two signals.
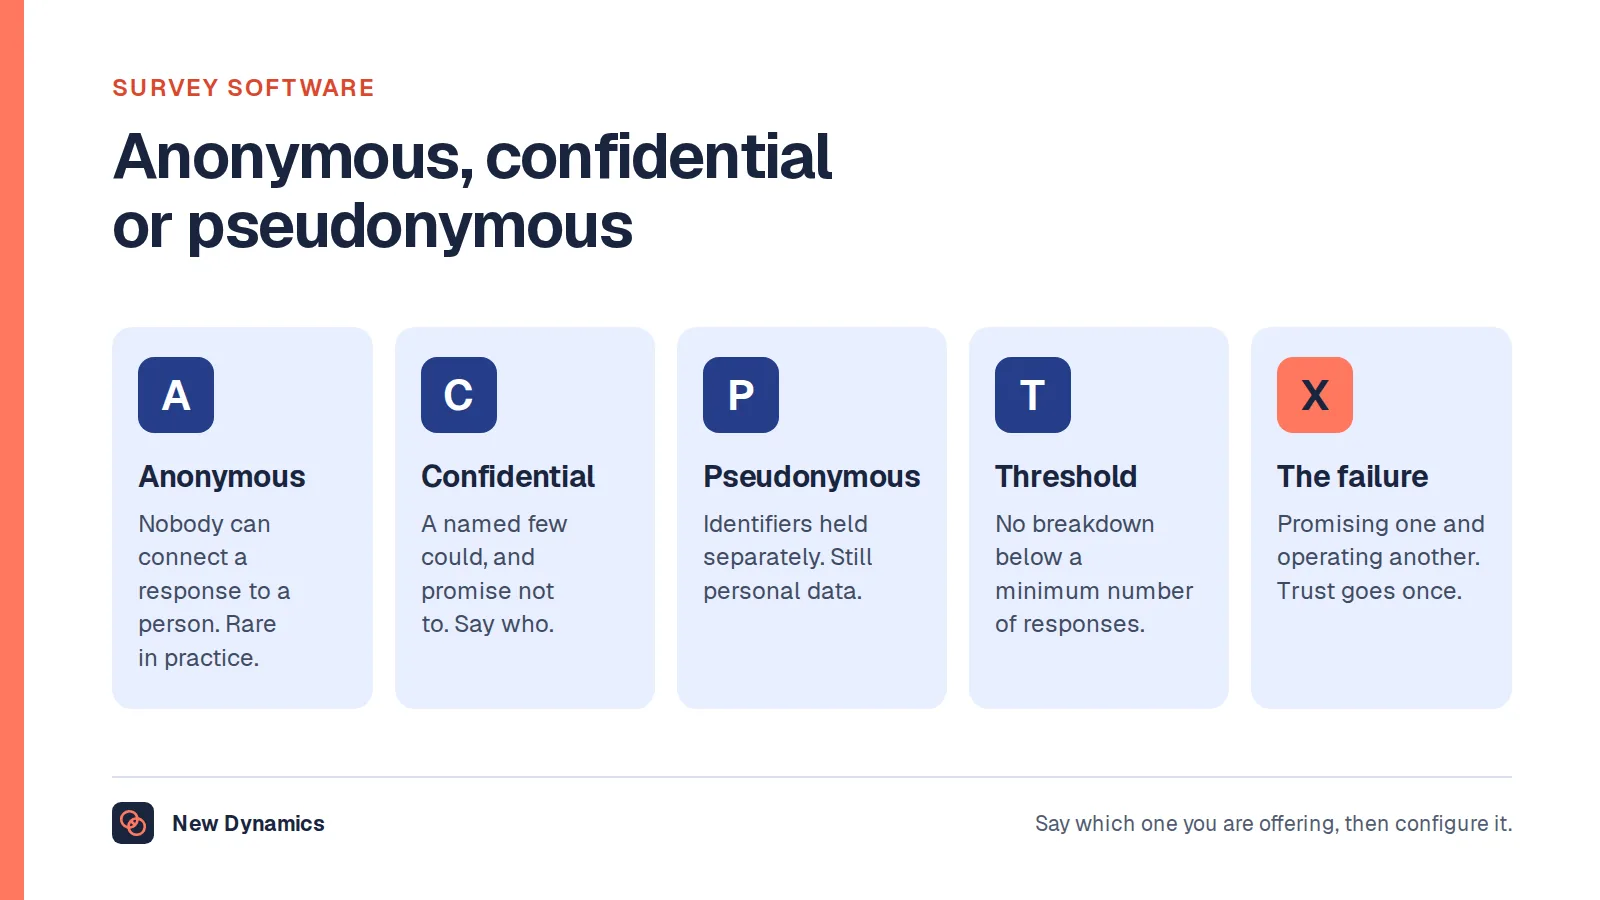
Anonymity is what buys an honest answer, and it has to be real rather than promised. Decide a minimum group size before the survey opens, publish it, and hold to it when a director asks for the numbers on a team of six. Be careful with filters: one can be safe while two combined identify a person, because department plus length of service plus part-time status will often leave exactly one candidate. Our guide to employee survey software covers the anonymity promise and the reporting threshold to insist on.
The data protection angle, which is sourceable
This is the one part of the subject with a proper authority behind it, and the rule is stricter than most survey practice assumes. This is general information about the position in the United Kingdom and not legal advice.
A genuinely anonymous survey sits outside UK data protection law. The Information Commissioner's Office puts it this way: "In data protection law, anonymous information is data that does not relate to an identified or identifiable person (ie data that is not personal data). Data protection law does not apply to anonymous information."
What counts as anonymous is where the wording tightens. The ICO's introduction to anonymisation says that "anonymous information does not relate to an identifiable person (either in isolation or when combined with information from other sources)", and that "Any information that does not meet this threshold is not anonymous information, and you must treat it as personal data."
That phrase, when combined with information from other sources, is the one that catches employee surveys. A score, a free-text comment and three demographic fields can be anonymous in a workforce of 4,000 and personal data in a team of nine.
The ICO's guidance on how to ensure anonymisation is effective names two key indicators, singling out and linkability, and defines the first: "Singling out means that you can single out the same person across records, or isolate the records that relate to a person from a dataset." It adds that "Even if you do not intend to take action about a person, the fact that they can be singled out may allow you, or others, to do so. This means the person is still identifiable."
Two consequences follow. If your survey is small enough or detailed enough that re-identification is reasonably likely, it is processing personal data, so a lawful basis, a privacy notice and retention limits all apply. And the honest course is often to stop calling it anonymous, call it confidential, and say who can see what. Both ICO pages carry a notice that the guidance is under review following the Data (Use and Access) Act, so check the current version before relying on it.
The ICO's wider employment practices and data protection collection covers the surrounding obligations, including its keeping employment records guidance, published in final form on 5 February 2025. Our employee data protection guide covers how this applies to the records you already hold.
Frequently asked questions
What does eNPS stand for?
eNPS stands for employee net promoter score. It is a single-question measure, adapted from customer research, that asks how likely someone is to recommend their employer as a place to work on a scale of 0 to 10.
How do you calculate an eNPS score?
Sort every response into promoters (9 and 10), passives (7 and 8) and detractors (0 to 6). Work out what percentage of all responses are promoters and what percentage are detractors, then subtract the second from the first. Passives count in the denominator but are never subtracted.
What is the range of an eNPS score?
From minus 100 to plus 100. Minus 100 means every respondent answered 6 or below, plus 100 means every respondent answered 9 or 10, and zero means promoters and detractors balance. It is a difference between two percentages, not a percentage itself.
What is a good eNPS score?
There is no official answer. No United Kingdom department, regulator or statistics body publishes an eNPS benchmark, so every figure offered as a good score comes from a survey vendor's own self-selected customers, usually without the composition of that dataset disclosed.
Why are two organisations with the same eNPS not alike?
Because subtraction discards the distribution. One organisation with 42 per cent promoters and 26 per cent detractors, and another with 54 per cent promoters and 38 per cent detractors, both score plus 16, while the second has far more people who would not recommend it.
Is an eNPS survey covered by UK GDPR?
It depends on whether it is genuinely anonymous. The ICO states that data protection law does not apply to anonymous information, but that anonymous information must not relate to an identifiable person in isolation or when combined with other sources. A small team plus demographic questions usually fails that test.
How many responses does eNPS need to be stable?
Enough that one answer cannot move it visibly. One person switching from promoter to detractor shifts the score by 200 divided by the number of responses, which is 0.8 of a point at 250 responses and 16.7 points at 12.
Your next step: make the number answerable
- Fix the wording, the 0 to 10 scale and the band boundaries, and write them down so the next round matches.
- Add one free-text question asking the main reason for the answer, and read every response.
- Report the score with the three band shares, the response count and the response rate.
- Set the minimum group size for team-level reporting before the survey opens, and publish it.
- Decide, in writing, whether your survey is anonymous or confidential against the ICO's test, and tell people which.
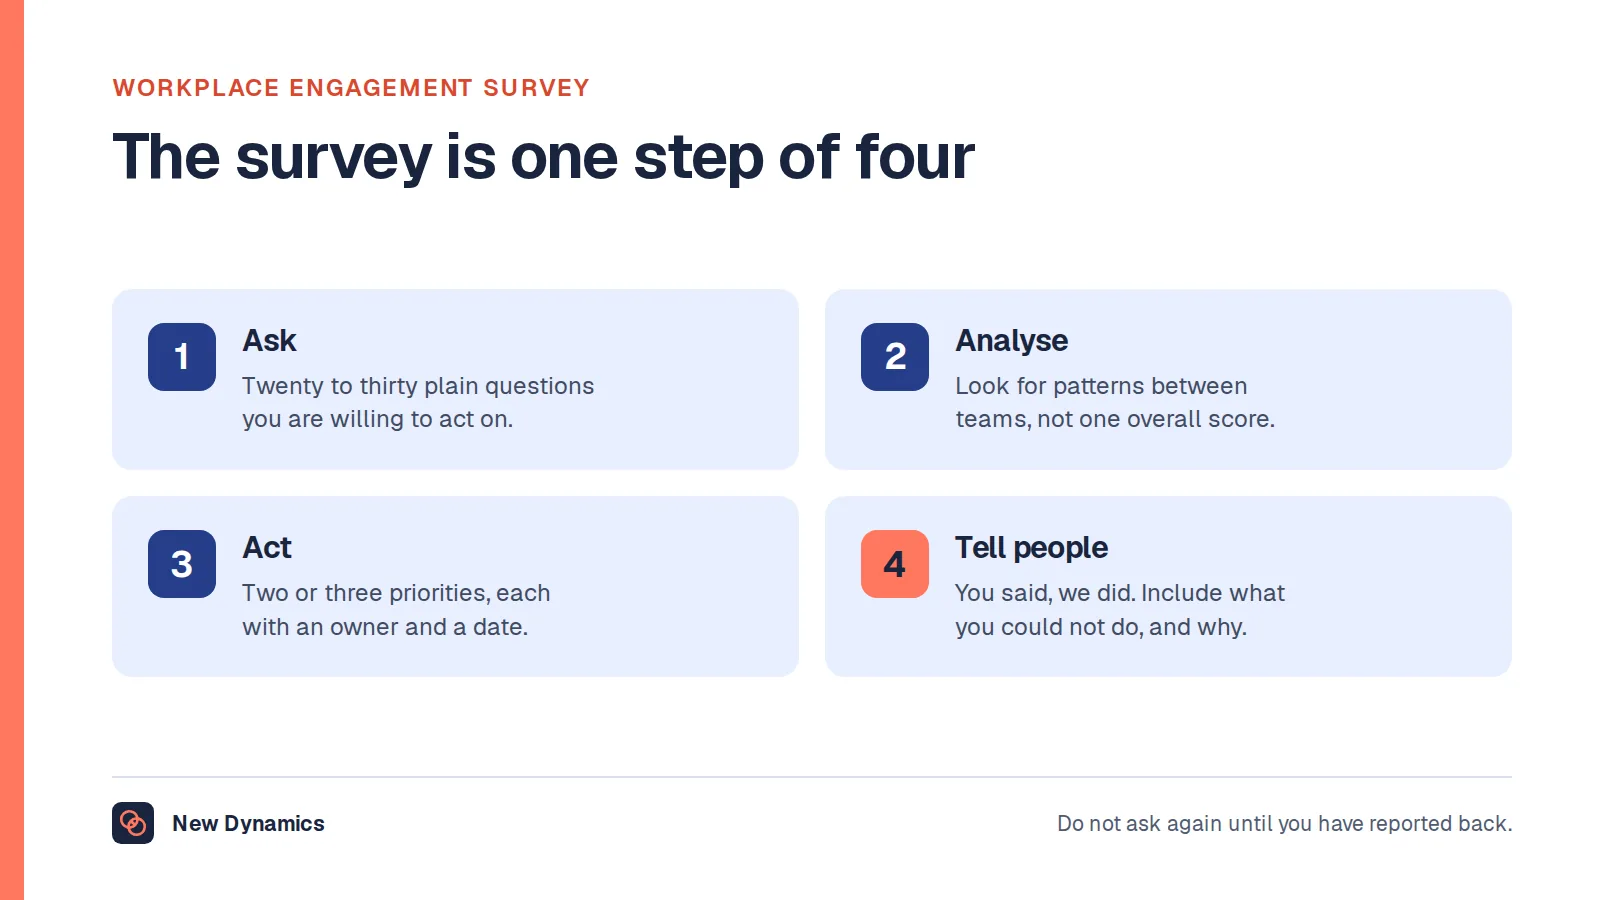
For a worksheet that takes you from asking to acting, read and download our employee engagement guide. The guide is free to read, and the PDF uses our short download form.
Want the comments behind the score to stay visible, instead of arriving once a quarter in a spreadsheet? Book a New Dynamics demo and bring your last survey results. You can also email contact@new-dynamics.com.