TL;DR
- HR analytics is sold as prediction and practised as counting. Descriptive and diagnostic work pays for itself; predictive work needs volume, data quality and a review most organisations have not done.
- The usual blocker is not the model but the record: one person held three ways across payroll, the HR system and the rota. The Government Data Quality Framework names the six dimensions that break.
- In the UK, predicting who will leave or scoring people is processing personal data. The ICO sets fairness and transparency duties, rules on solely automated decisions, and a data protection impact assessment where the risk is high. General information, not legal advice.
Somebody has asked for HR analytics. What they usually mean is a prediction: who will leave, which managers are a risk, which candidate will work out. What the HR team actually has is a payroll extract, a holiday system, a spreadsheet of review completions and the memory of two people who have been there long enough to explain the gaps.
This article is about that gap. It covers the three kinds of analysis and what each needs, the record-keeping problem that sinks most projects before the maths begins, why a team of nine cannot support a trend, how to tell a pattern from a cause, and the part most writing on HR analytics skips: the legal position in the UK when you start scoring people.
Most useful people analysis starts with a process that records itself properly, which is why the review cycle is the usual first dataset worth having. See how New Dynamics performance reviews record completion, dates and evidence as the cycle runs, rather than leaving you to reconstruct them afterwards.
For the measures themselves, our post on HR metrics explains why most people numbers cannot be compared between organisations, and our post on performance data for HR reporting sets out what a review cycle produces and what to refuse to report.
What HR analytics means, and what gets sold
Strip the word back and HR analytics is analysis applied to employment records: who is here, who left, who was promoted, who was trained, who completed what and when. It is the same discipline as any other reporting, with two differences that matter. The records are about identifiable people, so the law is engaged from the first query. And the populations are small, so the arithmetic is fragile.
What gets marketed is the far end of that range: prediction, risk scores, early warning, because prediction is the thing nobody can do in a spreadsheet. It is rarely mentioned that a prediction about a person is a regulated activity, that it needs several years of consistent records of people doing the thing you are predicting, and that it needs somebody qualified to say whether the output means anything.
We are not going to quote a figure here on how many organisations have reached some stage of analytics maturity, or what the return on an analytics project is. Those numbers circulate widely and we could not trace one to a UK official statistical source. Where no official source publishes a figure, the honest answer is that nobody has counted it, and a sourced absence is more use than a confident number with no method behind it. For the figures that are published, see our HR statistics hub.
Descriptive, diagnostic and predictive

Three different jobs sit under one word. They need different data, different skills and different levels of governance.
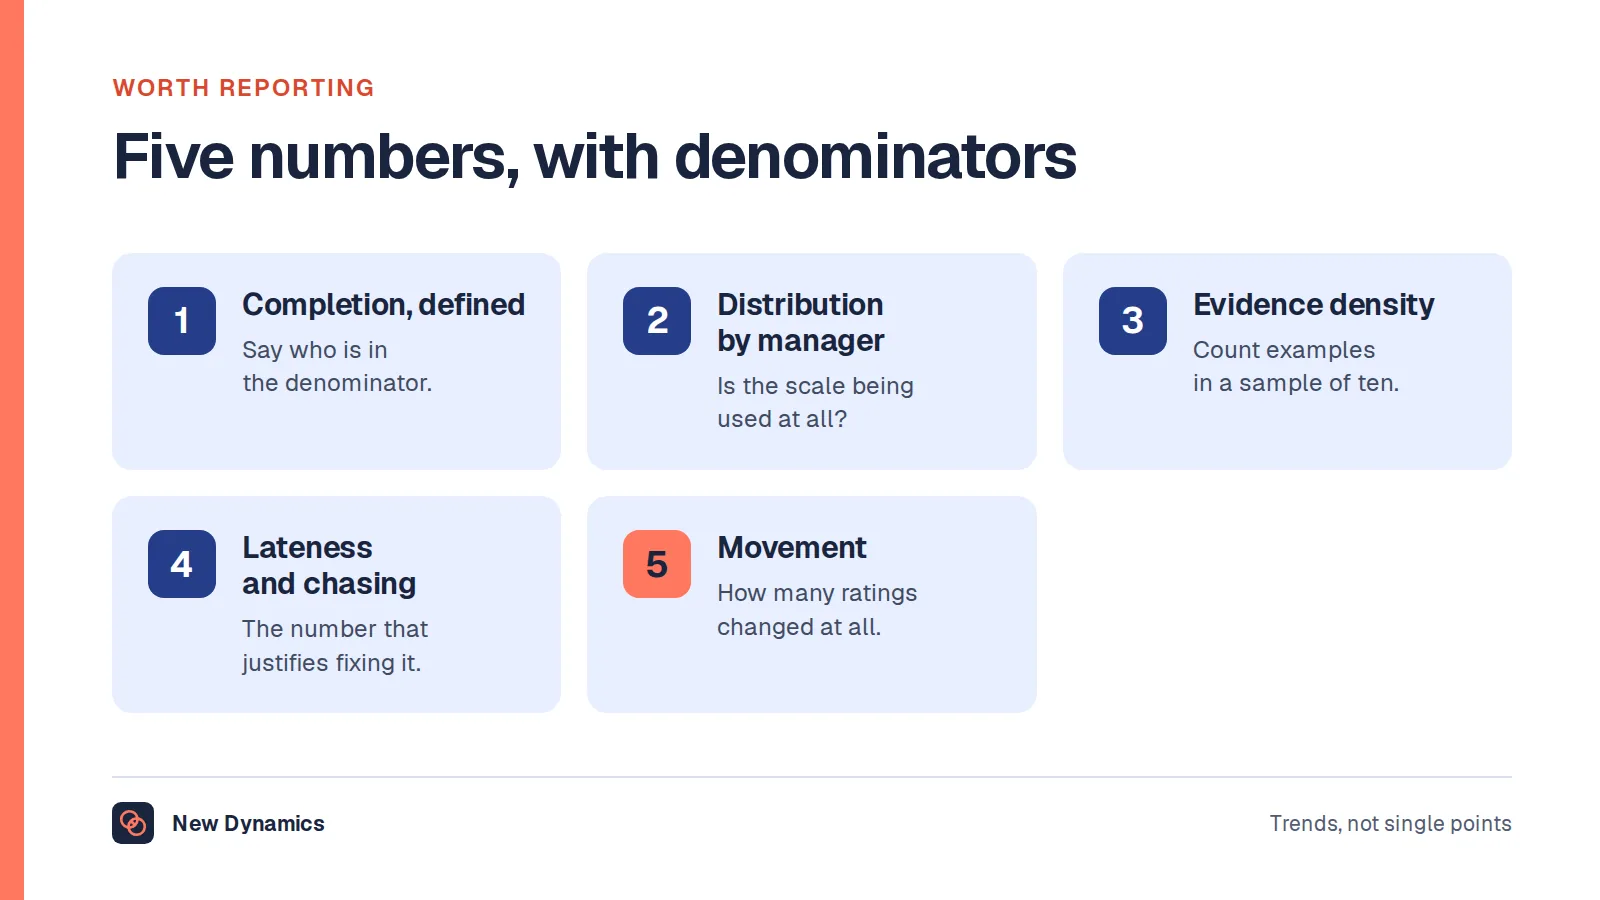
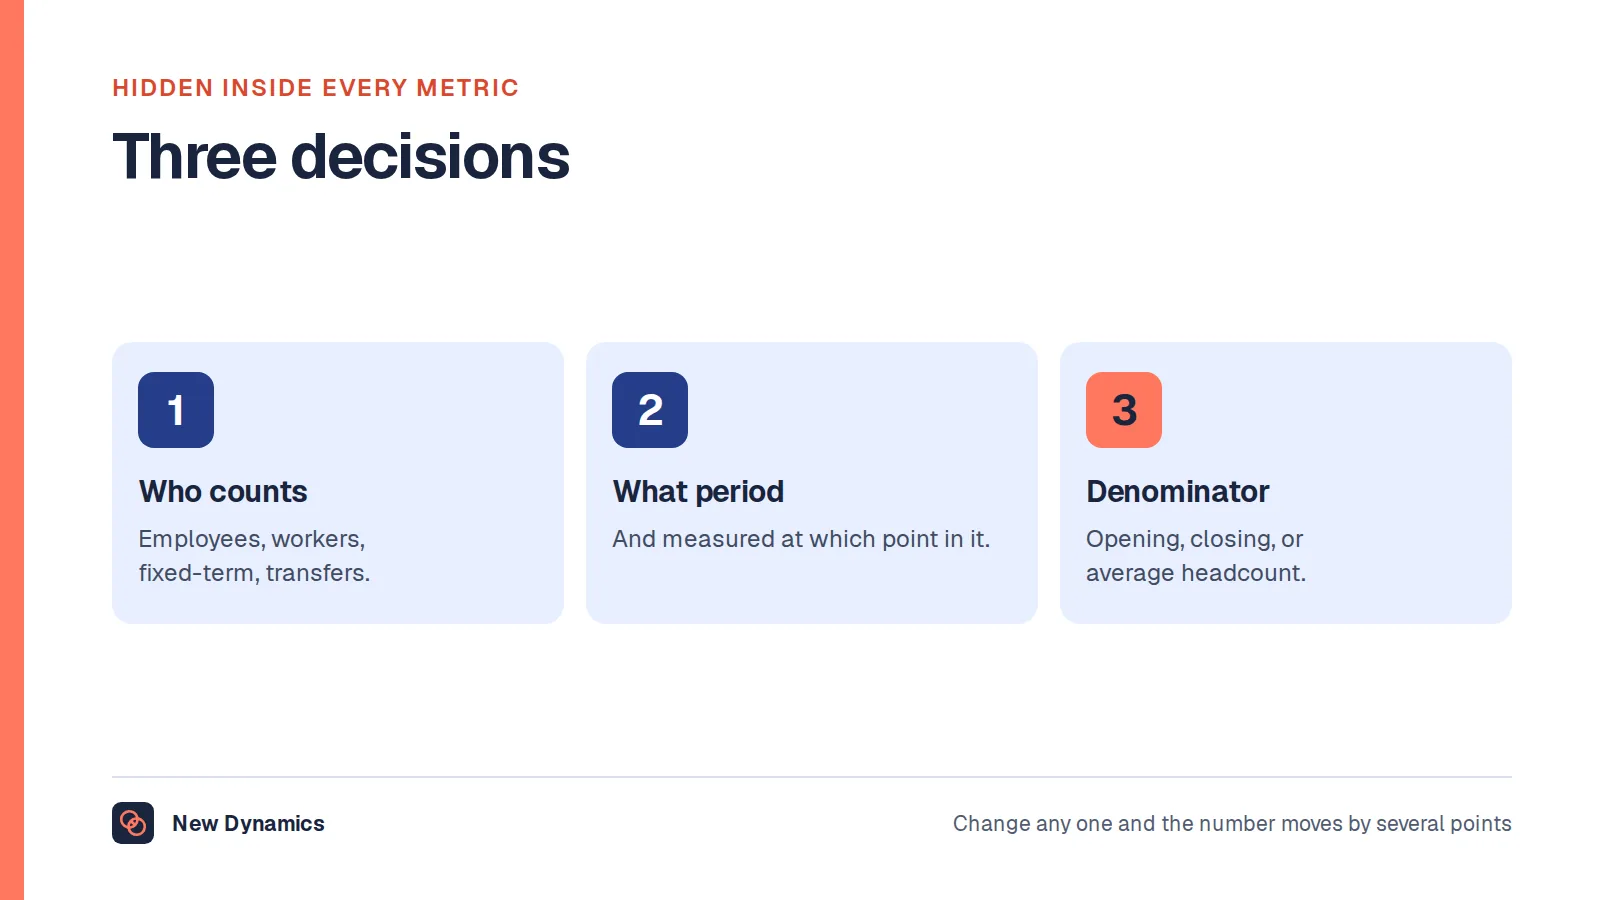
Descriptive analysis answers what happened. Headcount, starters, leavers, absence days, review completion, time to hire. It is counting, and it is where almost all the available value is, because most organisations cannot answer these questions consistently from one quarter to the next. Descriptive work needs one thing: a definition written down. Our post on the performance review completion rate shows how much hangs on a single definition decision.
Diagnostic analysis answers why it happened. Turnover rose; was it one team, one manager, one site, one grade, one cohort of starters? This is where analysis becomes useful, and it is almost entirely a matter of cutting the same descriptive numbers by something sensible and then reading the evidence behind them. It needs no model. It needs the ability to join two records about the same person, which is where the trouble starts (see below).
Predictive analysis answers what will happen. It takes historical patterns and produces an expectation about an individual or a group. A flight risk score, an attrition forecast and a model that ranks applicants are all predictive.
The order is not a maturity ladder to climb for its own sake. It is a sequence of dependencies. Diagnostic work is useless if the descriptive definitions move, and predictive work is worse than useless without the diagnostic work, because the model will faithfully reproduce whatever was wrong in the records.
Why most organisations are not ready for the third
Prediction needs enough past cases that a pattern is distinguishable from noise, measured consistently, over a period during which the organisation did not fundamentally change.
To predict leavers you need several years of leavers, each with a recorded reason, each classified the same way, in an organisation whose structure, pay and management have been stable enough that the old pattern still applies. Most employers fail at least two of those conditions. The reason codes changed when the HR system changed. The restructure in year two means year one describes a different company. Fixed-term endings were counted as resignations for eighteen months and then were not.
Scale is the other constraint, and here there is an official figure. The Department for Business and Trade's business population estimates, published on 2 October 2025, put the number of private sector businesses in the UK at the start of 2025 at 5.7 million. Of those, "5.64 million businesses were small (0 to 49 employees)", 38,435 were medium-sized at 50 to 249 employees and "8,335 businesses were large (250 or more employees)". The release notes that small and medium enterprises "account for 99.85% of the business population". It is published as official statistics in development, and the unregistered element is estimated and "subject to uncertainty".
Read that against what a predictive model needs. The great majority of UK employers do not have, and will never have, enough employment events for an individual-level prediction to be anything other than an expensive guess. That is not a failure of ambition but arithmetic, and it points at the work that does pay: definitions, joins and diagnosis.
The data quality problem that sinks it

Here is the usual failure mode, and it has nothing to do with statistics. One person is recorded three ways. Payroll holds Katherine Obi with a start date. The HR system holds Kate Obi with a different start date, because somebody typed the offer date instead. The rota system holds K Obi with no start date at all and a site code that was retired last year. Nothing links the three records except a human who knows they are the same person. Join them automatically and you get three employees, or one employee with contradictory service, or a leaver who never started.
The Government Data Quality Framework, published on GOV.UK, is the plainest official description of what is going wrong. It defines data quality as "fitness for purpose", asking "is this data set good enough for what I want to use it for?", and sets out six dimensions:
- Completeness "describes the degree to which records are present". The framework warns that "it is important not to confuse the completeness of data with its accuracy. A complete data set may have incorrect values in fields, making it less accurate."
- Uniqueness "describes the degree to which there is no duplication in records", meaning "the data contains only one record for each entity it represents". Its worked example is exactly our problem: a school database shows 501 records for 500 students because "Fred Smith and Freddy Smith" are held separately.
- Consistency "describes the degree to which values in a data set do not contradict other values representing the same entity", and notes that data is consistent "if it doesn't contradict data in another data set".
- Timeliness "describes the degree to which the data is an accurate reflection of the period that they represent".
- Validity "describes the degree to which the data is in the range and format expected".
- Accuracy "describes the degree to which data matches reality". The framework adds that bias may affect accuracy, because biased data "is not representative of the entire population".
The framework also makes the point that quality is relative to the use: improving one dimension can cost another, so "you should prioritise the data quality dimensions that align with your user and business needs".
The practical consequence for HR is unglamorous. Before any analysis, pick one system as the authority for identity and start date, decide how a person is matched across the others, and write down what you did. Then count the duplicates and the blanks and publish them next to the analysis. A number with a known duplication rate is usable. A number with an unknown one is not.
Which questions are worth asking
A question is worth asking when somebody can name the decision that follows from the answer. That test removes most of what gets requested.
Good questions look like this. Where in the joining process do new starters wait, and who owns each step? Which stage of the review cycle do managers miss, and does lateness cluster by team size or by manager workload? Do leavers in their first year differ from later leavers in which team they joined? Does absence cluster as many short spells or a few long ones, because absence management responds differently to each? Of the people who left, how many were people the organisation wanted to keep?
Weak questions look like this. What is our engagement score. Which managers are underperforming. Who is a flight risk. Each one either has no decision attached, or the decision it implies is one you should not be making from a number.
Write the question, the decision and the action before touching the data. Our free guide to AI and people analytics includes an analysis design worksheet for this, and the shortest route to a usable answer is almost always a better-defined question rather than a better tool.
Small numbers: why a team of nine cannot support a trend
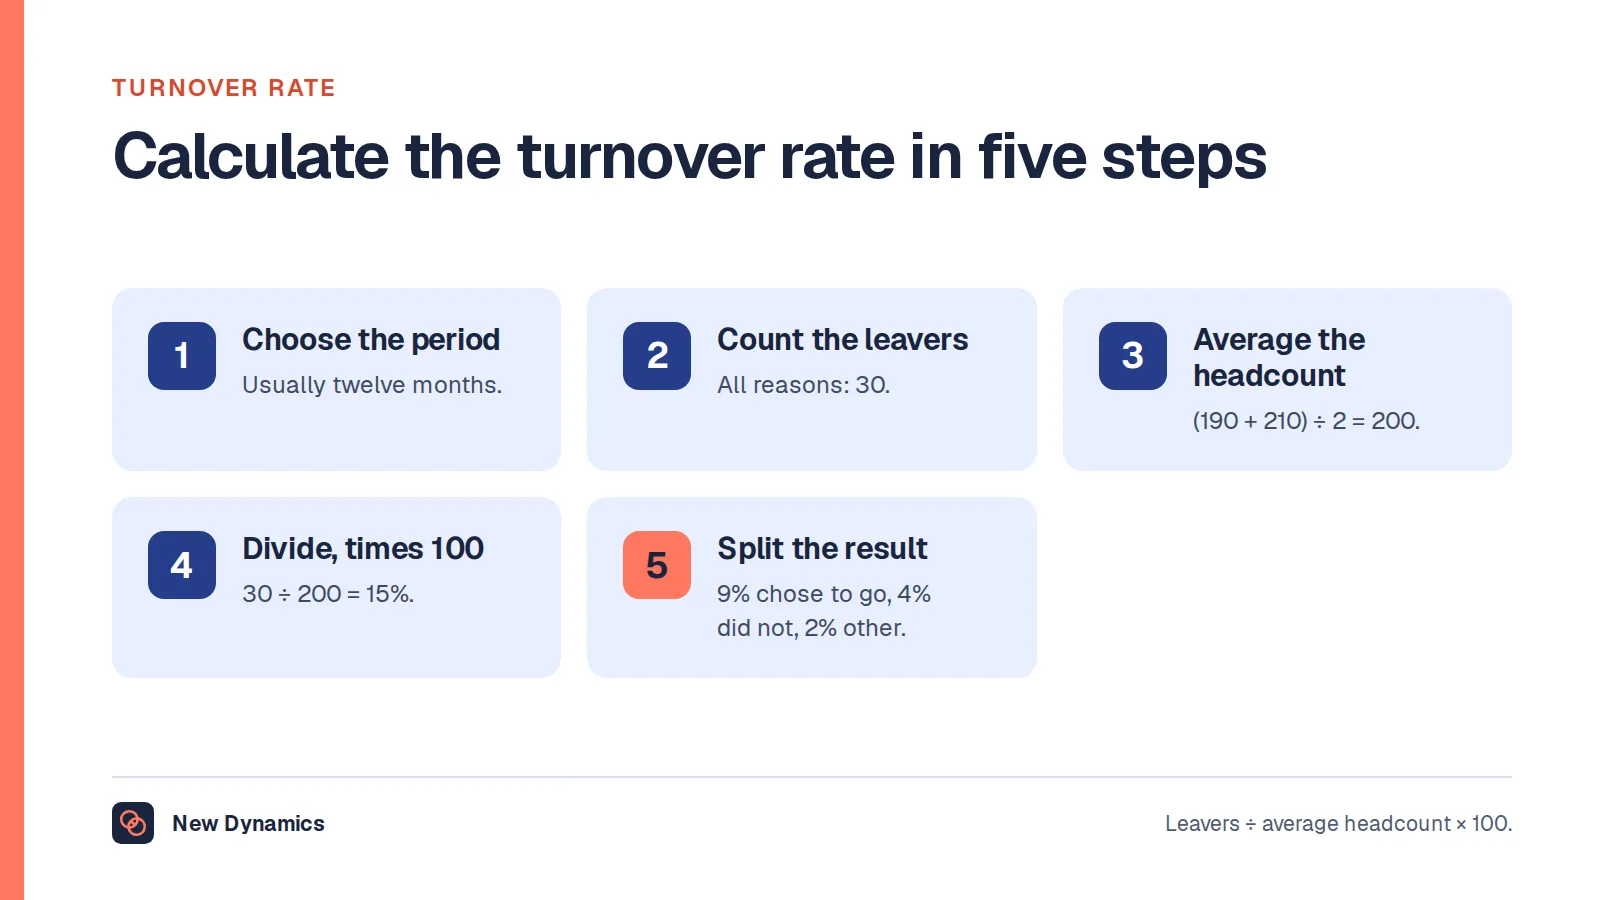
A team of nine loses one person. Turnover is 11%. Last year nobody left, so turnover was 0%. The chart shows an eleven point rise and somebody asks what has gone wrong with that manager.
Nothing has necessarily gone wrong. In a group of nine, every individual event moves the rate by about eleven points, so the only values the measure can take are 0, 11, 22 and so on. No trend can be read from a series whose smallest possible step is larger than the effect anyone is looking for.
The statistics profession has a formal version of this. The ONS page on uncertainty and how we measure it explains that "statistical significance helps us to establish what observed changes or relationships we should pay attention to, and which apparent changes may have occurred only as a result of randomness in the sampling", and that "a result is said to be statistically significant if it is likely not caused by chance or the variable nature of the samples". ONS adds a discipline worth copying: in its own bulletins it avoids the bare word significant when describing a trend, and always writes statistically significant instead.
Two caveats on borrowing that language. ONS is describing survey samples, while an HR team usually holds a complete count of its workforce, so the sampling-error vocabulary does not transfer directly. What does transfer is the second half of that page. It lists non-sampling errors, including "respondents giving inaccurate answers" and "processing or analysis errors", and states plainly that "these errors would be present in the statistics even if the entire population had been surveyed". A complete record of your own employees is not an accurate one.
There is a second reason to be careful with small groups, which is that they identify people. Acas makes the point about equality monitoring: "small businesses might not be able to use these forms because they're not able to guarantee confidentiality", and suggests an anonymous and voluntary staff survey instead. The same logic applies to any breakdown. A distribution for a team of four is a disclosure, whatever the chart calls it.
So set a floor. Do not report a rate for a group below a stated size, say where suppression applies, and aggregate upward or lengthen the period instead. Our posts on turnover rate and employee turnover calculation set out the definitions this depends on.
Correlation and cause in people data
People data is unusually good at producing correlations that mean nothing and unusually bad at proving why anything happened.
The pattern is familiar. People who used the learning platform were promoted more often, so the learning platform causes promotion. People who had more one-to-ones stayed longer, so one-to-ones cause retention. In both cases the obvious alternative explanation is that engaged, well-managed, already-progressing people do more of everything, and the thing you measured is a symptom of the same cause as the outcome.
The ONS smoking example is instructive precisely because the change there was real. Of a fall from 20.2% to 14.7% in the proportion of adults smoking, the page still says "we cannot assume that this change represents a real decrease", and only accepts it after a test showed the difference was "larger than expected if it had only been caused by random sampling". That order, pattern first and claim second, is the one to copy.
In practice, a correlation in people data is a prompt to read the evidence, not a finding. Acas's guidance on equality monitoring describes the right sequence: "analyse the information for any significant differences between groups based on protected characteristics", then "carry out an investigation if something needs looking into". The investigation is the analysis. The number only told you where to look.
Three habits help. Write down the alternative explanation before the conclusion. Check whether the thing you measured could be a consequence of the outcome rather than a cause of it. And before attributing a change to something you did, ask what else changed in the same period.
The law: predicting who will leave is processing personal data
This section describes the position in the UK under the UK GDPR and the Data Protection Act 2018. It is general information and not legal advice, and you should take your own advice on your own processing.
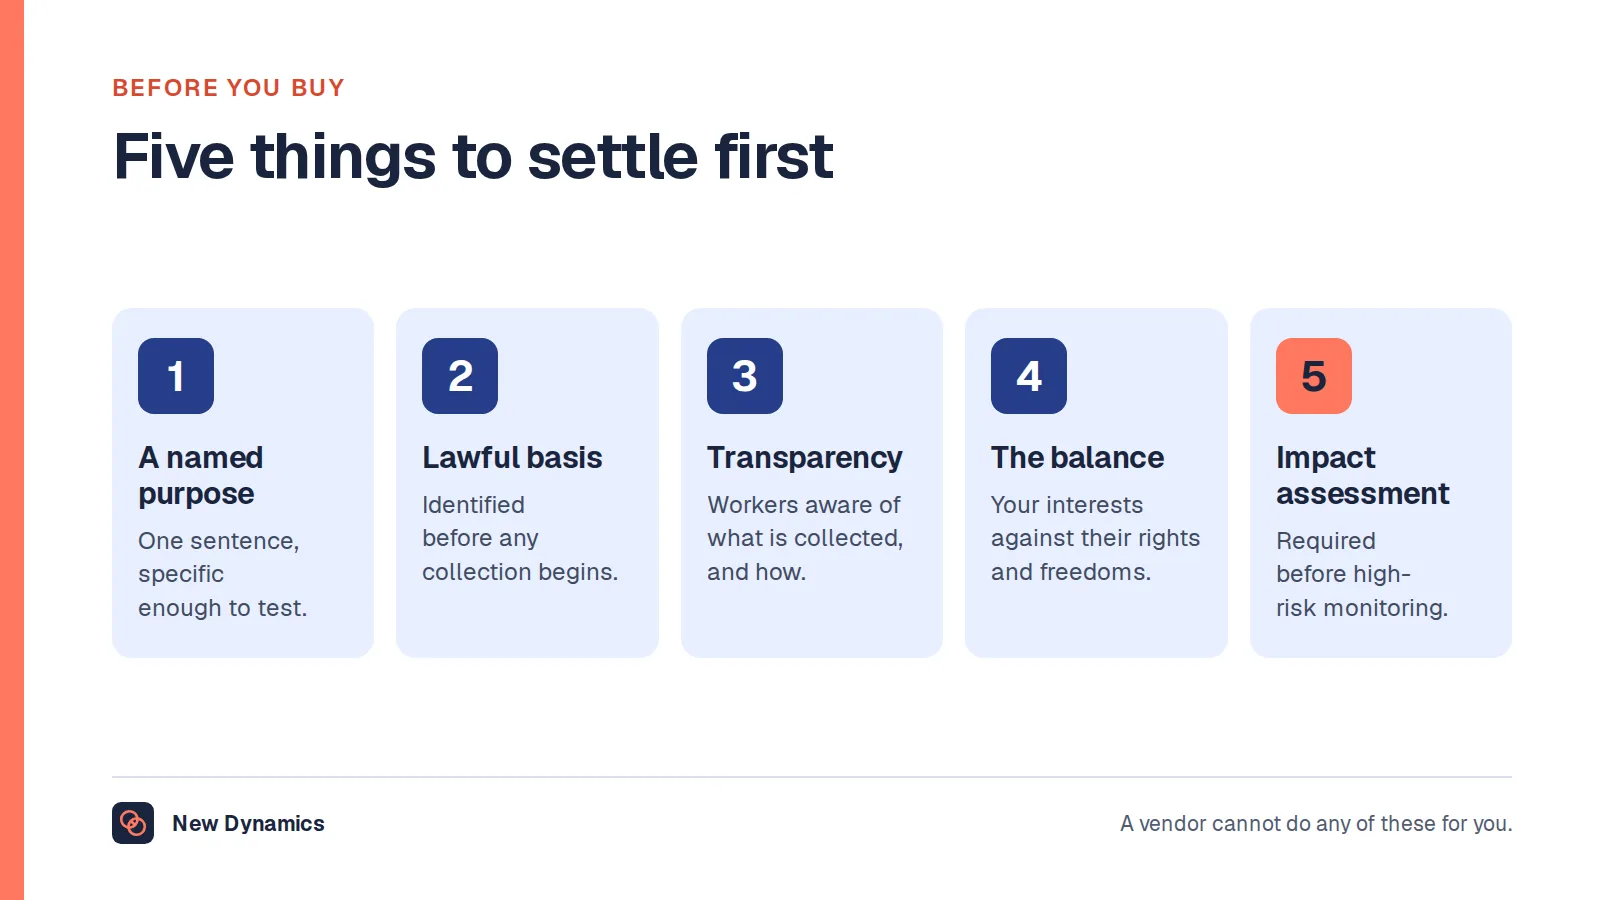
There is no analytics exemption. A leaver prediction, a flight risk score, a ranking of managers or a model that sorts applicants is processing personal data about identifiable people, and every principle applies.
Start with fairness. The ICO's guidance on the lawfulness, fairness and transparency principle says you must use personal data in a way that is fair, meaning "you must not process the data in a way that is unduly detrimental, unexpected or misleading to the individuals concerned". It expands on that: "in general, fairness means that you should only handle personal data in ways that people would reasonably expect and not use it in ways that have unjustified adverse effects on them. You need to stop and think not just about how you can use personal data, but also about whether you should." And it closes the obvious escape route: "it's not enough to show your processing is lawful if it is fundamentally unfair to or hidden from the individuals concerned."
Transparency is the paired duty. The same guidance describes transparent processing as "being clear, open and honest with people from the start about who you are, how and why you use their personal information, and their rights", and requires that "you must ensure that you tell people about your processing in a way that is easily accessible and easy to understand. You must use clear and plain language." A retention model that the workforce has never been told about fails this test on its own terms, whatever its accuracy.
Then accuracy, which is where analytics and record-keeping meet. The ICO's accuracy guidance requires you to "take reasonable steps to ensure the accuracy of any personal data" and to "ensure that the source and status of personal data is clear", and it scales the duty to the stakes: "the more important it is that the personal data is accurate, the greater the effort you should put into ensuring its accuracy. So if you are using the data to make decisions that may significantly affect the individual concerned or others, you need to put more effort into ensuring accuracy." It also notes that records "must make clear that it is an opinion, and, where appropriate, whose opinion it is". A manager's rating is an opinion. A model trained on those ratings is a model of opinions.
Our employee data protection guide covers records, access and retention, and our post on employee monitoring software deals with the surveillance end of the same question.
Automated decision making, profiling and meaningful human involvement
Scoring people has its own rules. The ICO's draft guidance on automated decision-making, including profiling, updated on 31 March 2026 to reflect the Data (Use and Access) Act 2025, is the current reference. It is explicitly draft guidance, so check it before relying on it.
Two definitions do most of the work. The ICO says automated decision-making "is where you use personal information to make a significant decision about someone using solely automated processing, including profiling". And profiling "is where you analyse, evaluate or predict aspects of someone's personality, behaviour, characteristics, interests, or habits". The statutory definition it quotes is squarely about work: profiling is "any form of automated processing of personal data consisting of the use of personal data to evaluate certain personal aspects relating to a natural person, in particular to analyse or predict aspects concerning that natural person's performance at work, economic situation, health, personal preferences, interests, reliability, behaviour, location or movements."
A flight risk score is profiling. So is a model that predicts performance. Profiling by itself is not prohibited, and the ICO notes that "this profiling activity can create new personal information as a result of the analysis". The score is now personal data you hold about that person, subject to access requests and to the accuracy principle.
The stricter rules bite when a decision is both significant and solely automated. The ICO's guidance on what the UK GDPR says about automated decision-making explains that a decision is significant if it "produces a legal effect for the data subject" or if it "has a similarly significant effect for the data subject", and lists "employment opportunities and circumstances (eg recruitment, promotion)" among the things to weigh. It names "e-recruiting practices without meaningful human involvement" as an example of a similarly significant effect. Its worked employment example is a factory worker whose "pay is determined by an algorithmic system that makes predictions about their productivity", with no human review, which the ICO treats as solely automated decision-making with significant effects.
"Solely" is defined by what the human does, not by whether a human exists. A decision "is based solely on automated processing if there is no meaningful human involvement in the taking of the decision", and for involvement to be meaningful "you must ensure it is active and not just a token gesture". The ICO lists what the human must be able to do: "assess and review the decision at an appropriate point to ensure actual impact on the outcome", "have discretion and authority to alter the decision", and "be suitably trained and qualified to understand the system's logic, outputs, limitations, and risks". Three further points catch out most real processes. "Using ad hoc spot-checking isn't sufficient because some automated decisions won't receive a check and therefore don't have meaningful human involvement." The involvement must come before the decision is applied, "at a time you can still change any recommendation". And "a human merely designing or building an automated system does not count as meaningful human involvement".
The contrast in the guidance is a useful design target. Where a clocking-in system flags lateness but "the decision to issue it is taken by the employer's HR manager following a review of that data", the ICO calls that meaningful human involvement.
Where the rules do apply, the safeguards are four, and the ICO says they must be applied "consistently rather than on an ad hoc discretionary basis": provide the person with information about the decision, enable them to make representations about it, enable them to obtain human intervention, and enable them to contest it. Human intervention "cannot be tokenistic", and "spot checking an ADM process doesn't meet the requirements of this safeguard".
The ICO is also direct about the risks, in terms any HR team will recognise. "Algorithmic systems may reflect historical inequalities or societal biases, depending on the training data", and using them "may replicate or even amplify these biases". And two sentences worth pinning above the project: "due to the predictive nature of profiling, there will always be a margin of error", and "there's no guarantee that what may be representative of a large part of the population is automatically going to be the same at the individual level".
What a data protection impact assessment is for

A data protection impact assessment, or DPIA, is the step that turns all of this from an opinion into a decision you can defend.
The ICO describes a DPIA as "a process designed to help you systematically analyse, identify and minimise the data protection risks of a project or plan". It "does not have to eradicate all risk, but should help you minimise and determine whether or not the level of risk is acceptable in the circumstances, taking into account the benefits of what you want to achieve". It is scalable: "conducting a DPIA does not have to be complex or time-consuming in every case, but there must be a level of rigour in proportion to the privacy risks arising", and "there is no definitive DPIA template that you must follow". Note that this particular guidance says it is under review following the Data (Use and Access) Act.
Two warnings from the same page. A DPIA "is not simply a rubber stamp or a technicality as part of a sign-off process", and it is "a 'living' process" to keep under review rather than a document to file.
When is a people analytics project in that territory? The ICO's guidance on when you need a DPIA sets out the triggers, and several land on HR at once. One of the three automatic cases is "any systematic and extensive evaluation of personal aspects relating to natural persons which is based on automated processing, including profiling, and on which decisions are based" that significantly affect the person. The ICO's own list adds "large-scale profiling", "data matching", meaning "combining, comparing or matching personal data obtained from multiple sources", and innovative technology including AI. The European criteria it reproduces include "evaluation or scoring", "matching or combining datasets" and "data concerning vulnerable data subjects". In most cases, says the ICO, "a combination of two of these factors indicates the need for a DPIA".
That last criterion deserves attention, because HR teams routinely miss it. The ICO states that "one group who may count as vulnerable in this sense are employees", because "a power imbalance means they cannot easily consent or object to the processing of their data by an employer". An analytics project that joins payroll, the HR system and the rota in order to score people has, on the ICO's own list, hit data matching, evaluation or scoring, and vulnerable data subjects before anybody has written a line of code.
Our post on performance data for HR reporting covers the narrower question of reporting the cycle itself.
Frequently asked questions
What is HR analytics?
Analysis applied to employment records in order to answer a question somebody will act on. In practice it covers three different jobs: describing what happened, diagnosing why it happened, and predicting what will happen. The first two are where almost all the available value sits, and they need clear definitions rather than new software.
What is the difference between HR analytics and people analytics?
Nothing substantive. The terms are used interchangeably, with people analytics more common in larger organisations and in writing about data science, and HR analytics more common where the work sits inside the HR function. Both describe analysis of employment data. Neither implies a particular method or tool.
Is predictive analytics for HR worth doing?
Only where the conditions exist: several years of consistently classified events, enough people that an individual-level pattern is distinguishable from chance, a stable organisation, a named decision the output will inform, and a qualified review of validity, bias and lawfulness. Most employers in the UK are small, so for most the honest answer is to invest in definitions and record quality first.
Does predicting which employees will leave count as profiling?
In the UK, yes. The ICO describes profiling as analysing, evaluating or predicting aspects of someone's behaviour or characteristics, and the statutory definition expressly covers predicting aspects concerning a person's performance at work. The resulting score becomes personal data you hold about that person. This is general information rather than legal advice.
Do we need a DPIA for an HR analytics project?
Often. A data protection impact assessment is required where processing is likely to result in a high risk to people, and the ICO's triggers include evaluation or scoring, large-scale profiling, matching data from multiple sources, and processing data about vulnerable people, a group that the ICO says may include employees. A joined-up scoring project usually hits several at once. Take your own legal advice.
How many people do you need before an HR metric means anything?
Enough that a single event does not move the figure past the effect you are trying to see. In a team of nine, one leaver moves turnover by about eleven percentage points, so the measure has no useful resolution. Report such groups only in aggregate or over a longer period, and set a minimum group size, because small breakdowns also identify individuals.
Your next step: make the data answer one question
- Pick one question somebody will act on this quarter, and write the decision next to it.
- Name the system that owns identity and start date, and write down how a person is matched across the others.
- Count the duplicates and the blanks in the fields you need, and publish both next to the answer.
- Set a minimum group size for reporting, and say where suppression applies.
- If any output would score or rank a person, stop and screen it for a DPIA before you build it.
For the analysis design worksheet, the verification steps and the limitations to record beside a conclusion, read and download our guide to AI and people analytics. The guide is free to read, and the PDF uses our short download form.
Want a review cycle, goals and feedback that record themselves properly, so the numbers exist without a reconstruction exercise? Book a New Dynamics demo and bring the report you are asked for today. You can also email contact@new-dynamics.com.