TL;DR
- Decide what the chart is for before choosing a tool. An induction aid, a record of reporting lines, a planning view of vacancies and spans, and a diagram for a board pack are four different products wearing one name.
- Hand-drawn charts go stale because the drawing is a copy. The fix is to generate the chart from the record that already holds people, roles and managers, and to name one person who corrects the record rather than the picture.
- A chart is personal data, and sharing one outside the organisation is a disclosure. Test permissions, dotted lines, vacancies, contractors and an accessible text version in the demo, not after rollout.
Almost every organisation has an org chart somewhere. It is usually a slide. It was accurate on the morning it was drawn and has been wrong since the first person changed team. Nobody deletes it, because it is the only one, and nobody updates it, because that means redrawing boxes.
Org chart software is sold as the answer, and most of it answers a narrower question than yours. This page takes the question the tools skip: what is the chart for, where does its data come from, and who is responsible when it is wrong.
To see what a chart looks like when it is generated from a people record rather than drawn, start with New Dynamics org charts, which holds reporting lines alongside the working relationships a single line leaves out.
Plainly, so you can discount it as you read: this is a category we sell into. The rest of this page assumes you may buy elsewhere, keep using a spreadsheet, or decide you do not need a chart at all. It will not name, rank, compare or price any product, including ours.
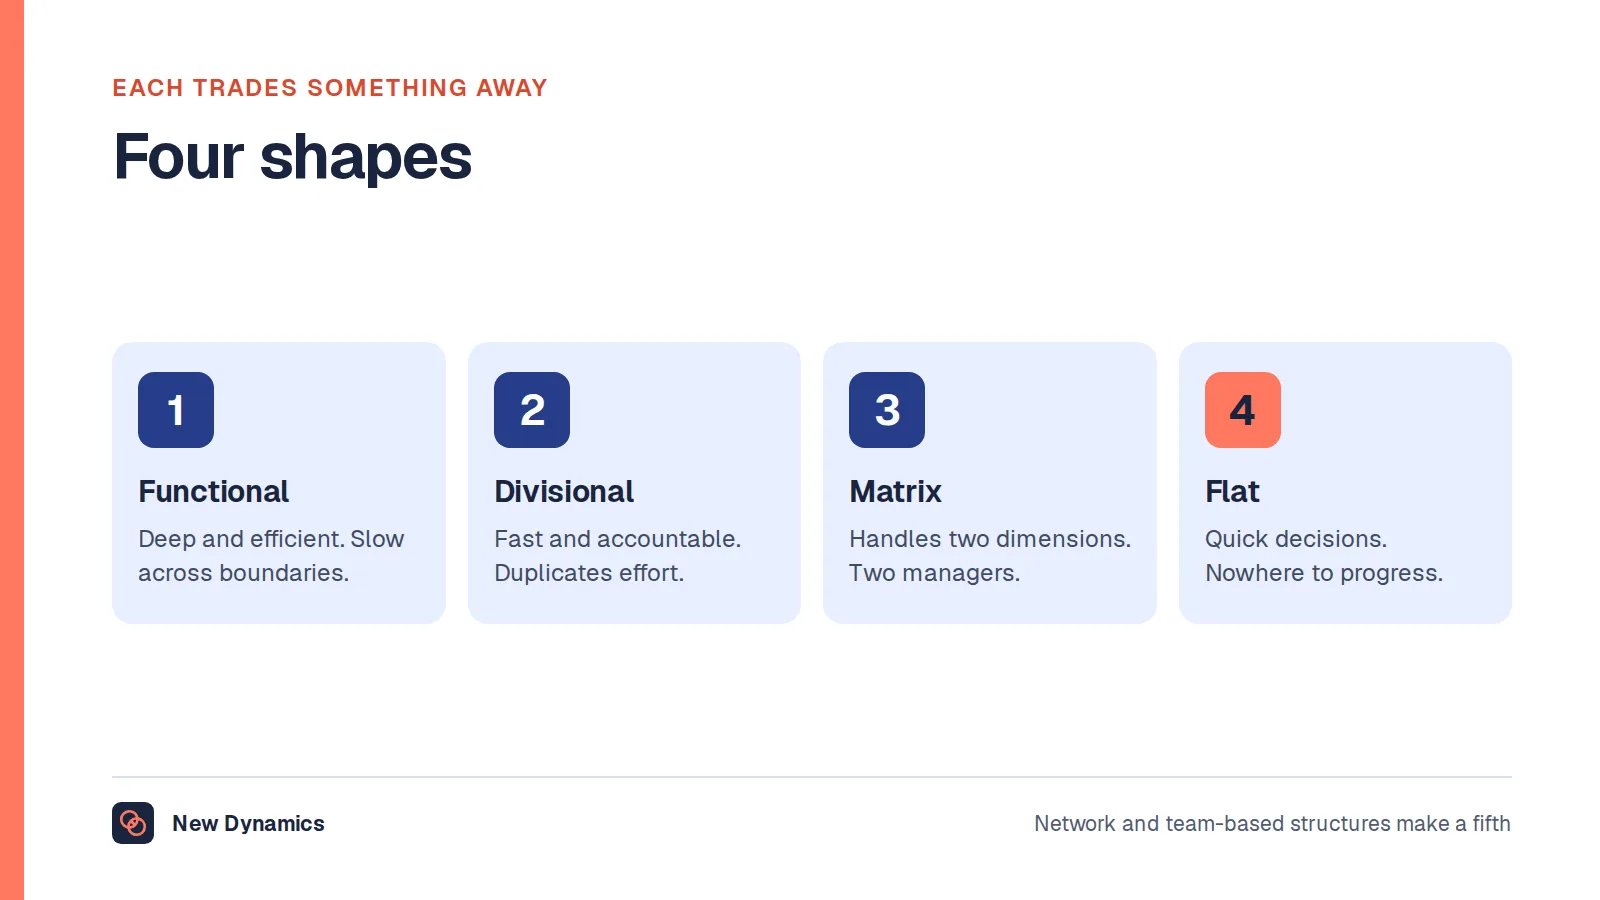
Organizational structure covers the shapes themselves and what a restructure costs; this post is about the software that draws whichever shape you have. On naming: British English says "organisation chart", American English "organization chart", and whether a product calls itself an org chart builder, an organization chart program or software for organization charts, it draws the same diagram.
What an org chart is actually for
This question decides everything else, and most org chart makers never ask it. They assume you want a picture. You want one for a reason, and the reasons pull in different directions.
An induction aid. A new starter needs to know whose name is on the email they just received and who to ask about expenses. This version needs photographs, plain job titles, locations and a search box. It need not be complete. Our post on the employee onboarding process covers the first week.
A record of reporting lines. Somebody has to approve leave, write the appraisal and hear a grievance. This version has to be exactly right, because a wrong line sends an approval to the wrong person.
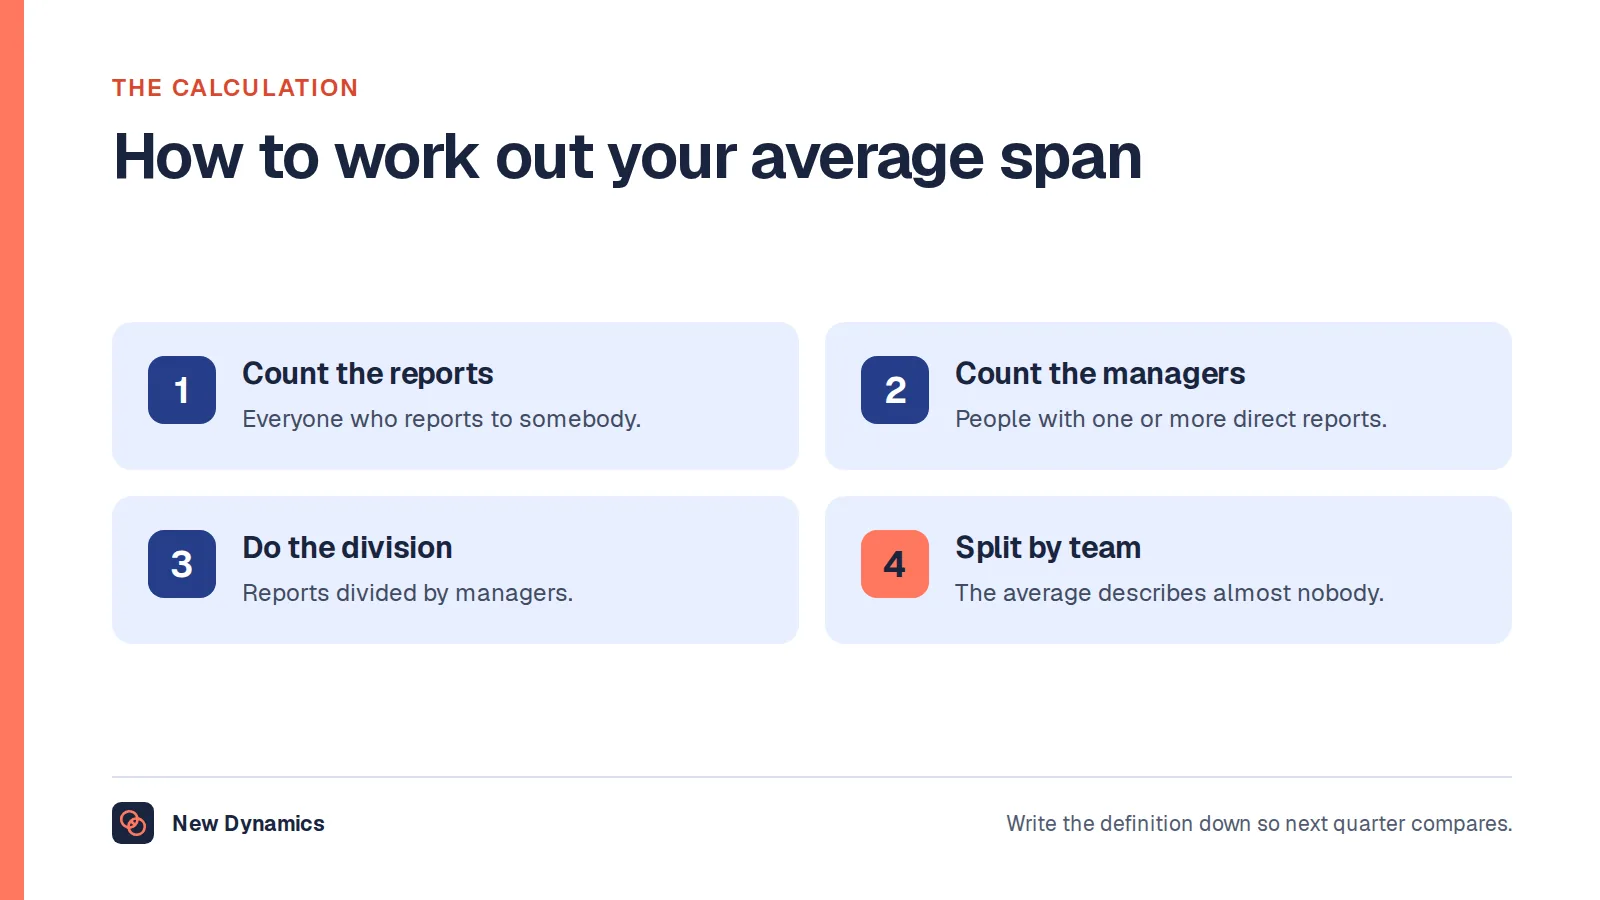
A planning document. How many layers sit between the chief executive and the shop floor, and which manager has nineteen direct reports while another has one? This version needs vacancies drawn as boxes, spans counted, and a way to model a change without committing to it. Our post on the average span of control covers the numbers.
A vacancy and succession view. Who would cover this role if its holder resigned today? The version most often requested and least often honest, because it collapses into a list of favourites. Read succession planning first, which argues for capability rather than named replacements.
A diagram for a board pack. Tidy, symmetrical, printable on one page. The version that gets made, because it has a deadline, and the version nobody maintains.

Those are five different products. A tool that excels at the board diagram is usually poor at the reporting record, because it lets you put a box anywhere, which is what you do not want when the box has to mean something. So write down what yours is for. If the answer is "a board pack once a year", a diagram tool and an afternoon is the right purchase.
Why hand-drawn charts go stale, and what fixes it
Charts rot for one structural reason, and it is not laziness. The drawing is a copy. The real information lives in payroll, in an HR record, in a line manager's head. The chart is a second version made by hand, and the moment the first changes the copy is wrong and nothing in the copy knows it.
Everything else follows. A joiner's box is missing. Someone moves team and the line still points at the old manager. A manager leaves and their reports hang off an empty box.
The timescale is faster than people expect. In a two-hundred-person organisation, a handful of joiners, leavers and moves in a month is unremarkable, and a handful is enough for a reader to spot something wrong. Once they find one error they stop trusting the whole diagram, which is why a chart that is 95% right gets used less than no chart at all.
There are two real fixes.
Generate the chart instead of drawing it. The chart becomes a view of a record rather than a document in its own right. When somebody's manager changes in the record the chart changes, because it was only ever a rendering of the record. This is what separates an org chart generator from a drawing tool.
Give the chart an owner and a correction route. Even a generated chart will be wrong, because records are wrong. What matters is that a reader who spots an error has somewhere to send it, and that the fix goes into the record rather than the picture. Without that route a chart decays whatever drew it.

Where the data comes from, and why the record matters more than the picture
Every chart has a source: a system, a person's memory, or last year's chart, which is the worst case because the error compounds.
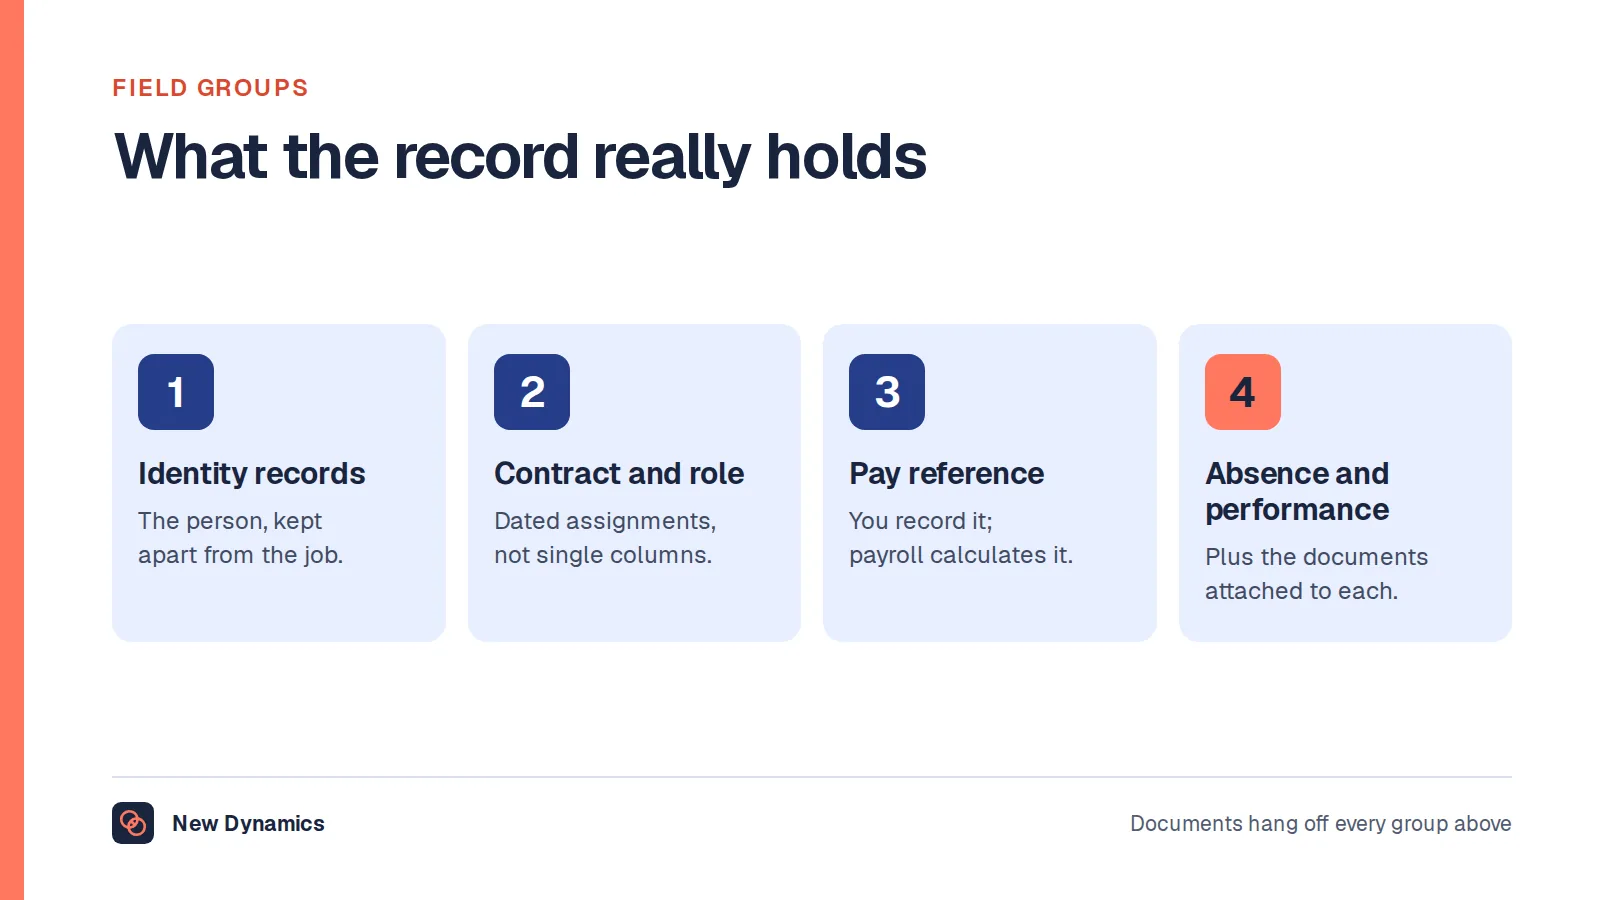
- Which system owns the reporting line? Not which holds one, which is usually several. One has to win when they disagree. Our post on the employee management system sets out what that record holds.
- Which fields does it need? Fewer than you think: name, job title, manager, team, location and whether the person is current. Salary almost never.
- How does it get the data? A nightly sync, a manual import, a live connection, or somebody retyping it. A manual import is fine if somebody owns it, fatal if it is "whenever we remember".
- What happens when the record is wrong? Every chart eventually shows somebody reporting to a person who left. Does the tool show that or hide it?
- Who maintains it? One named person, not "HR", which is a department and therefore nobody.

Data quality and data protection are one subject here. In the United Kingdom, the Information Commissioner's Office sets out the accuracy principle and says you "should take all reasonable steps to ensure the personal data you hold is not incorrect or misleading as to any matter of fact", and "may need to keep the personal data updated, although this will depend on what you are using it for". It also separates a current record from a historical one, and says "you must be clear that it is a historical record". An org chart is read as current, so if it is a snapshot from March, label it as one.
The ICO's data minimisation principle is a quick test of the chart's fields, requiring personal data to be "adequate, relevant and limited to what is necessary in relation to the purposes for which they are processed". A date of birth fails that test, a home postcode fails it, and so, for almost every purpose, does pay. This is general information about UK data protection practice and not legal advice.
Dotted lines, matrix reporting and more than one manager
The single line from box to box is why most charts are quietly wrong, because real work does not run on one line.
A consultant reports to a practice lead for their career and an engagement lead for the current project. A site engineer reports to a regional manager and takes technical direction from a discipline head. An analyst sits in finance and spends four days a week in a product team. None has one manager in any meaningful sense, and all have one in the system, because the system has one field.
Tools handle this in three ways, and they are not equally useful.
They ignore it. One manager, one line, and the rest is private knowledge. Tidy, and less than the truth.
They allow a second line with different styling. A dashed line to a second person. Better, and where most charts stop. The weakness is that the dash means nothing in particular: project lead, mentor, technical authority or functional owner, so the reader guesses.
They name the relationship. The second link carries a type, so the chart says "project lead" or "mentor" rather than showing a dash. This is the version worth paying for, because the type determines who does what. A functional owner contributes to the appraisal. A mentor should not.
Three questions for any tool. Can a person have more than one manager, and can each relationship be named? Does the chart say what each line means? Does anything downstream use the second relationship, or is it decoration? That last one separates a chart from a working record. Where the second relationship drives who takes part in a review, reviewing an employee who changed manager covers the mechanics, and multi-manager reviews is the feature that exists because of it.
Contractors, agency workers, vacancies and long leave
These cases break more charts than matrix reporting does, because they ask who belongs on the chart at all.
Contractors and self-employed people. They do the work, they sit in the team, and they are not employees. In the United Kingdom, GOV.UK's guidance on employment status says that "in employment law a person's employment status helps determine" both "their rights" and "their employer's responsibilities", and that "courts and tribunals can make final decisions on employment status". So a box is not a statement of employment status. Mark contractors as contractors, and do not let the chart become evidence in an argument about whether somebody was really an employee. GOV.UK points readers to Acas, or the Labour Relations Agency in Northern Ireland. This is general information, not legal advice.
Agency workers. GOV.UK's guidance on agency workers' rights explains that "you're an agency worker if you have a contract with an agency but you work temporarily for a hirer". On a chart they are usually either invisible or indistinguishable from employees, and both are wrong. Invisible makes the team look smaller and the manager's span lighter.
Vacancies. A chart with no vacancies shows the organisation you have, not the one you are trying to run. One with vacancies is a planning document, and the version a finance director wants. The difference is one field: can a box exist for a role with nobody in it?
Open roles are routine. The Office for National Statistics reported in Labour market overview, UK: October 2026, released on 20 October 2026, that "early estimates for July to September 2026 suggest a decrease of 21,000 (2.9%) to 691,000, compared with April to June 2026". That is a national stock figure rather than a statement about one employer, and our HR statistics hub collects what official sources publish. No official UK source publishes a figure for how fast a chart goes out of date, so if a supplier quotes one, ask for the publication and the date.
People on long leave. Maternity or parental leave, long-term sickness, a sabbatical, a secondment. The person still holds the role and someone else is doing the work. Ask how the tool shows cover, and whether the person on leave disappears, which is inaccurate and, to them, pointed.
Leavers. A leaver's box should go from the current chart, and their reports should not silently reparent to a random manager. Ask what happens to the people beneath a removed box, and whether the old chart survives as a snapshot.
Who can see what
An org chart is an access-control problem dressed as a diagram. Most tools default to everybody seeing everything, which is often right and occasionally a serious mistake.
Which people appear. Most organisations show everyone. Some do not show a team working on an unannounced acquisition, or a protected individual whose location should not be inferable. If anyone has a safety reason not to be findable, that is a requirement for the tool, not a manual exception.
Which fields appear. One rule keeps this safe: the chart should never reveal a field the viewer could not already see in the record. If it becomes a side channel around your permissions model, it is a problem whatever it looks like.
Who can edit. Drawing tools give edit rights to whoever has the file. Generated charts give none, because only the record can be edited, which keeps the change history in one place.
Ask two things explicitly. Whether a share link needs a login, because one that does not is a published chart whether you meant it or not. And whether export is restricted, since a chart anyone can export has permissions only until the first export.
What a free org chart maker gets you, and what it costs
Much of the search traffic here wants a free online org chart maker, an easy org chart maker or a free org chart builder. Three routes qualify.
A spreadsheet. One row per person, with a column for their manager. This is not a stopgap. A sheet of that shape is a complete reporting-line record: it sorts, it filters, it counts spans of control, and several spreadsheet programs turn a parent and child list into a diagram automatically. For thirty people this is the right answer, and buying software instead is spending money to feel organised.
A general diagram tool. Drawing applications, presentation software and whiteboard tools all draw boxes and lines, and several have a hierarchy layout. You get full control of appearance, which matters for a board pack, and no connection to any record, which means maintaining a copy by hand.
The chart inside something you already pay for. Many HR systems, staff directories and identity platforms draw a chart from data they already hold. This is often the best free option, because the data is already maintained. Check before buying: you may already own an org chart tool. Our post on HR tools maps what a stack already does.
What the free routes cost is maintenance, and the bill arrives monthly. Every joiner, leaver and move is applied by hand, by somebody who knows about it, in a file they can find. Small at thirty people, unmanageable past two hundred.
What paid tools typically add, in shape rather than by brand:
- A live or scheduled connection to the record that holds people and managers, so the chart is generated rather than maintained.
- Permissions that follow the record instead of the file.
- More than one relationship per person, with the relationship named.
- Vacancies, cover and employment type as proper fields rather than annotations.
- History, so you can see the structure as it stood in April and when it changed.
- Planning views, search, filters and counts, which turn a diagram into a planning document.
- An export that includes the data, not only the picture.
The honest trigger for leaving a spreadsheet is not headcount. It is whether the chart is wrong often enough that people have stopped using it, and if so, redrawing will not fix it, because the problem is the copying.
A chart is personal data, and publishing one is a disclosure
This is the section most buyer's guides omit, and the likeliest to cause a problem. Start with what the chart is. In the United Kingdom, the ICO's guidance on what is personal data quotes the UK GDPR definition: "'personal data' means any information relating to an identified or identifiable natural person ('data subject')". It is explicit that work contact details count: "a name and a corporate email address clearly relates to a particular individual and is therefore personal data". So a chart of names, roles and reporting lines is a structured set of personal data, and the ordinary obligations apply.
What changes when the chart leaves the building is the interesting part. The ICO's data sharing code of practice treats internal circulation and external disclosure differently. On data sharing covered by the code, the guidance says "the code does not apply to the disclosure of data within the same organisation, where the controller is one and the same", adding that "the other obligations under data protection law obviously still apply, however". Its scope, from section 121 of the Data Protection Act 2018, is "the disclosure of personal data by transmission, dissemination or otherwise making it available".
A chart on your intranet is internal. The same chart in a tender response, a pitch deck, a public website or a folder a client can open is a disclosure. ICO guidance on fairness and transparency in data sharing states that "you must treat individuals fairly and not use their data in ways that would have unjustified adverse effects on them", that "when you share personal data, you must ensure it is reasonable and proportionate", and that "before sharing data, you must tell individuals about what you propose to do with their personal data in a way that is accessible and easy to understand".
So four things before a chart goes outside. Decide whether names are needed at all, because a chart of roles is a far smaller disclosure. Strip fields the external purpose does not need, such as photographs and direct dial numbers. Check that your privacy information covers sharing a chart carrying someone's name and role. And record what you sent and when.
One caution about detail. The ICO lists "special categories of personal data" requiring "a higher level of protection", including a person's "race", "trade union membership", "health data" and "sexual orientation". Charts rarely carry that directly and sometimes carry it by implication: a box labelled "union liaison", or cover that reveals why somebody is absent. Look at what the chart implies, not what it states.
All of this describes UK data protection law. It is general information and not legal advice, and your data protection lead should see any proposal to publish a chart externally. Our employee data protection guide covers the wider picture, and employee records retention covers how long the record should be kept.
Accessibility: a diagram is not readable to everyone
An org chart is one of the least accessible objects in common office use. It carries meaning through position and line, and it is usually delivered as an image.
GOV.UK's guidance on publishing accessible documents is blunt about the image problem: "do not use images containing text, as it's not possible to resize the text in the image and screen readers cannot read text which is part of an image". For charts it offers two options, either to "make the same point in the text of the document" or to "give the person converting or uploading the document for you alt text ('alternative text') for the image or chart". It also warns that you should "not use things like colour or shape alone to show meaning", so a dashed line with no label fails the test. That is a second reason to name the relationship rather than style it.
For public sector employers in the United Kingdom there is a legal dimension. GOV.UK's guidance on accessibility requirements for public sector bodies, updated on 30 September 2024, explains that "intranet and extranet websites are covered by the accessibility regulations" and that "these are internal websites which disabled employees working in or with the public sector may use". The requirement is to "meet the Web Content Accessibility Guidelines (WCAG) 2.2 AA accessibility standard" and to "publish an accessibility statement that explains how accessible your website or mobile app is". The same page notes that "the Equality Act 2010 in England, Scotland and Wales and the Disability Discrimination Act 1995 in Northern Ireland covers all public sector bodies". This is general information about the position in the United Kingdom and not legal advice.
For a private employer the accessibility regulations do not apply, and the same checks are still worth making, because the accessible version of an org chart is the list it was generated from.
Four checks for any tool. Is there a text equivalent, such as a table of person, role and manager, that a screen reader can read in order? Can the chart be navigated by keyboard? Does zooming to 200% keep the labels readable? Is every relationship labelled in text rather than by line style alone? A tool that can only produce an image is a drawing tool: fine for a slide, not an intranet.
What to check in a demo
Feature lists will not separate these products. Scenarios will. Ask every supplier to run the same ones with data that looks like yours.
- Import a hundred people with a manager column, with two deliberate errors: a circular reporting line and a manager missing from the list. Silent acceptance is wrong.
- Move one person to a different manager in whatever system owns that fact, and show the chart changing without anyone touching it.
- Add a second relationship, name it, and show where that name appears outside the diagram.
- Show a vacancy as a box with nobody in it, counted in headcount, then put somebody on long leave with cover and show how both appear.
- Add a contractor and an agency worker, and show how a reader tells them apart from employees.
- Remove a leaver with four direct reports. Automatic reparenting keeps the chart tidy and starts it lying.
- Log in as an ordinary employee and show which fields they see, then a manager, then an administrator. Share the chart by link and see whether it opens for somebody with no account.
- Export it, and check you get the data and not only an image.
- Turn on the accessible view and navigate by keyboard only.
- Show the chart as it stood six months ago. A tool holding only the current structure cannot say who managed whom last March, which is what an appraisal dispute will ask.
- Model a reorganisation without publishing it, discard it, and show nothing leaked into the live chart. Then print it: four hundred people on one page is a test most tools fail.
Watch for two patterns. If a reporting line exists only inside the chart tool, you have built a second people record that will disagree with the first within a quarter. And if a reader has no way to report an error, nobody will.
Our performance management software RFP template turns this into something you can send to several suppliers at once, and HR software selection covers running a selection without a feature-count spreadsheet.
No rankings here
Many searches that reach a page like this want a ranked list: the best org chart software, the top org chart tools, the best software for org chart work. This site does not publish those, and will not name, rank, compare or price any product in this category, ours included. The reasons are set out in why we do not publish a top 5 HRIS list: rankings are often shaped by commercial relationships a reader cannot see, and even an honest one cannot know your structure or whether your record is in good enough shape for any tool to help.
What we can offer is the test above. Run those eleven scenarios against three options, including the spreadsheet you have and the chart inside a system you already pay for, then choose the one whose output you would trust in three months.
Frequently asked questions
What is org chart software?
Org chart software draws a diagram of an organisation's reporting structure. The useful kind generates it from a record that already holds people, job titles and managers, so the chart changes when the record does. The less useful kind is a drawing tool producing a picture you maintain by hand.
What is the difference between an org chart maker and an org chart generator?
Suppliers use the words interchangeably, so look at the mechanism, not the label. A drawing tool places boxes anywhere with no link to any record, which suits a board pack. A generator renders the chart from a source record such as an HR system, so a change of manager appears without anyone redrawing it.
Is there a good free online org chart maker?
Yes, three of them. A spreadsheet with one row per person and a manager column is a complete reporting-line record and will often produce a diagram automatically. Diagram and presentation tools draw hierarchies well. Many HR systems and identity directories already include a chart, so check what you pay for first. All three cost you manual maintenance.
Which is the best org chart tool?
There is no single best org chart tool, and this site does not publish vendor rankings. The right choice depends on what your chart is for, where its data lives, whether people report to more than one manager and who may see what. Answer those four, then run the same scenarios against a spreadsheet and one paid option.
Is an org chart personal data under UK GDPR?
Yes. The Information Commissioner's Office defines personal data as information relating to an identified or identifiable person, and says a name with a corporate email address is personal data. A chart of names, roles and reporting lines is a structured set of personal data, so the accuracy and data minimisation principles apply. This is general information about the position in the United Kingdom and not legal advice.
Can we publish our org chart on our website or in a tender?
You can, but treat it as a disclosure rather than a formatting decision. ICO guidance separates moving data inside one organisation from sharing it externally, and says sharing must be reasonable and proportionate and that people must be told what you propose to do with their data. Consider a chart of roles without names, and involve your data protection lead.
Your next step: find out whether your chart is generated or drawn
- Open the chart you use today and ask where these reporting lines came from, and what happens when one of them changes.
- Write one sentence saying what the chart is for: induction, reporting lines, planning, cover, or a board pack.
- Count the errors. Take ten people at random and check their manager, their team and whether they still work there.
- Name the person who owns the record behind it, not the picture, then take the eleven scenarios above to whatever you are considering, including the spreadsheet.
For the record-keeping side, read and download our HRIS selection guide. For the disclosure side, the employee data protection guide. Both are free to read, and the PDFs use our short download form.
To see reporting lines, second managers and the review cycle in one place, book a New Dynamics demo and bring the chart you use today. You can also email contact@new-dynamics.com.